filmov
tv
Data analysis and visualization in Python: Python Crash Course - Episode 15

Показать описание
We'll explore data visualization in Python, using Matplotlib and Plotly.
Timestamps:
0:00 - Introduction
0:35 - Data visualization
2:04 - Installing Matplotlib
2:28 - Plotting a Simple Line Graph
12:11 - Exercise 1: Plotting a Simple Line Graph
14:09 - Random Walks
23:35 - Exercise 2: Random Walks
29:08 - Rolling Dice with Plotly
39:10 - Exercise 3: Rolling Dice with Plotly
44:47 - Summary
 0:02:26
What is Data Analytics and Visualization?
 0:08:16
I started my data analyst career taking these beginner courses
 0:27:21
Data Visualization Tutorial For Beginners | Big Data Analytics Tutorial | Simplilearn
 0:04:08
Data Analytics - The 9 Essential Tools! (2024)
 0:11:02
Data Visualization in 2024 | The Ultimate Guide
 0:10:20
A Beginners Guide To The Data Analysis Process
 0:04:18
What Does a Data Analyst Actually Do?
 0:05:00
What is Data Analytics | Data Analytics in 5 Minutes | Intellipaat
 0:10:59
How I Would Learn Data Analysis (If I Could Start Over in 2024)
 0:22:01
Intro to Data Analysis / Visualization with Python, Matplotlib and Pandas | Matplotlib Tutorial
 0:15:50
The Evolution Of Data Visualization | Dustin Cabral | TEDxBryantU
 0:17:04
How to Install Tableau and Create First Visualization | Tableau Tutorials for Beginners
 0:01:30
Python in Excel: a powerful combination for data analysis and visualization
 0:10:55
FASTEST Way to Become a Data Analyst and ACTUALLY Get a Job
 0:09:04
What Is Data Analytics? - An Introduction (Full Guide)
 1:53:40
Introduction to Data Analysis with Excel: 2-Hour Training Tutorial
 4:22:13
Data Analysis with Python - Full Course for Beginners (Numpy, Pandas, Matplotlib, Seaborn)
 0:07:09
Science of Data Visualization | Bar, scatter plot, line, histograms, pie, box plots, bubble chart
 0:17:42
Data Analysis 2: Data Visualisation - Computerphile
 0:00:48
How I'd Learn to Become a Data Analyst
 0:00:31
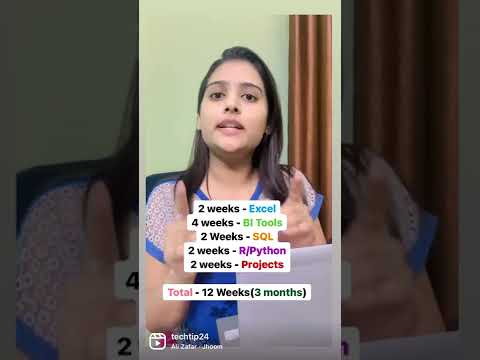
Data Analytics 3 months roadmap #dataanalytics #datascience #upgradeskill #livetraining
 0:17:11
🚨 YOU'RE VISUALIZING YOUR DATA WRONG. And Here's Why...
 0:11:15
Your first 10 minutes of Power BI - A no-nonsense getting started tutorial for beginners
 0:25:57
Data Visualization Crash Course | Consulting Best Practices
Комментарии