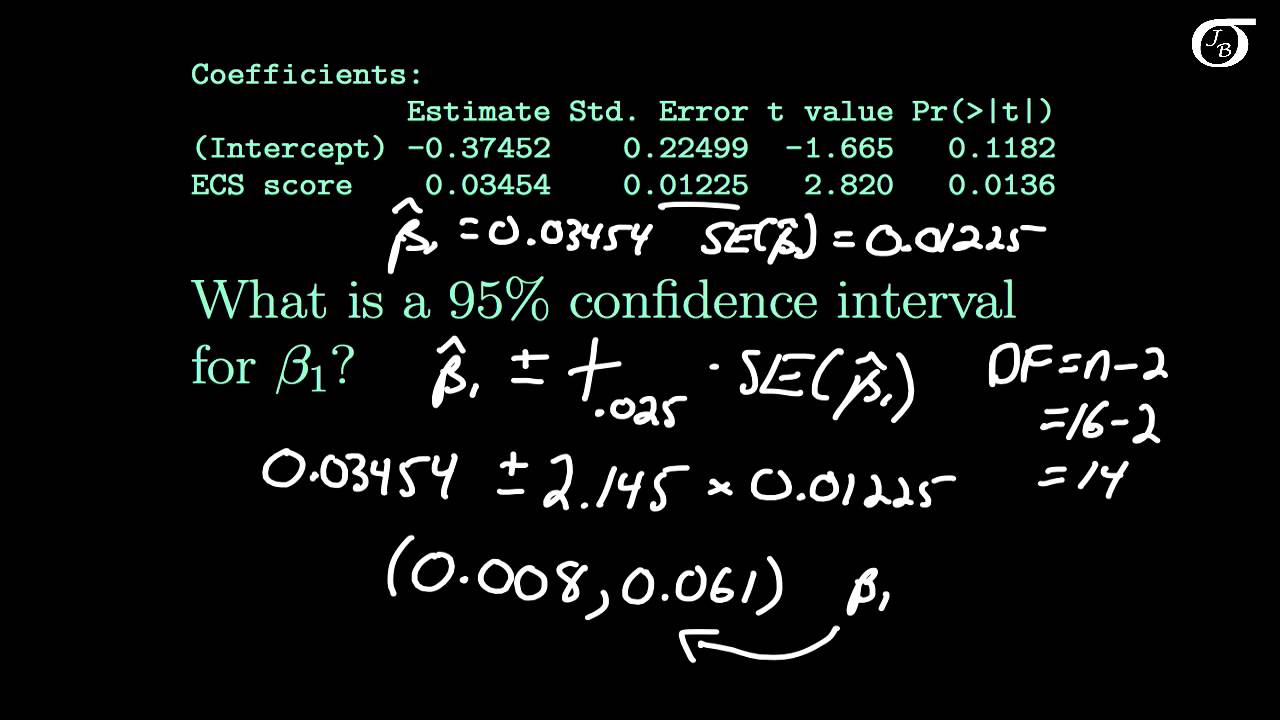
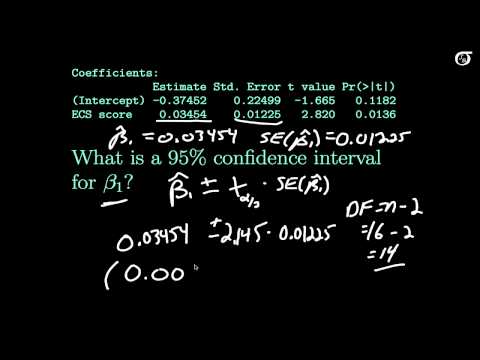
Inference on the Slope (An Example)

preview_player
Показать описание
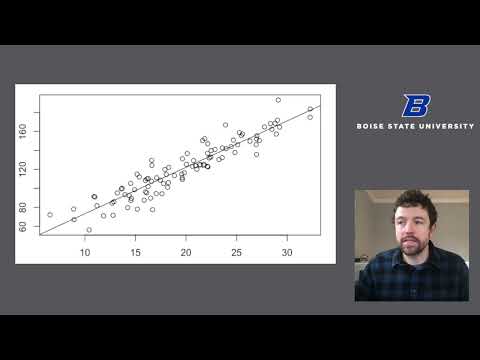
I work through an example of finding a confidence interval and carrying out a hypothesis test on the slope parameter.

The data used is estimated from a figure in:

Singer et al. (2004). Empathy for pain involves the affective but not sensory components of pain. Science, 303:1157--1162.
Рекомендации по теме
Комментарии
Автор

This video has literally saved me from impending doom. I can't thank you enough for uploading this, including the explanation of what the various terms in the 'R' dataset relate to.

abditorium
Автор

You are welcome, and thanks very much for the compliment! I'm very glad to be of help. Cheers from Canada.

jbstatistics
Автор

This video series on chapter 27 just saved my life man. Thank you so much

nikolaystoykov
Автор

Thanks Tina! I do my best to help people understand the practical meaning of what we do. It's definitely not all about the calculations here.

We calculate confidence intervals for parameters. Sometimes the parameter of interest is a proportion (e.g. estimating the approval rating of a country's leader), sometimes it's a mean (e.g. estimating the average calorie intake of 8 year old boys in a certain school system), and sometimes it's another parameter like a slope, or a variance…

jbstatistics
Автор

You're welcome Rob. I'm glad to be of help. It's not every day that I get to save someone from impending doom!

jbstatistics
Автор

thank you much! you make the concept much clearer and the theories fun

jordanazheng
Автор

...In spirit, we're trying to accomplish the same goal in all of these situations (estimating the parameter, while incorporating uncertainty into the equation), but we use different methods because the underlying mathematics changes in the different scenarios. Cheers.

jbstatistics
Автор

Thanks! Multiple regression is definitely part of the plan. These days I'm attacking subject areas more as big projects rather than videos here and there, so it might take me a while. I'll get to multiple regression, but it will be a big project and I have a few other topics on the agenda first.

jbstatistics
Автор

You're welcome. I hope you learned something and your exam went well.

jbstatistics
Автор

YOU'RE THE BEST, thank you for not just showing how to calculate the CI which everyone else does but fr actually interpreting what the CI means in practical terms! One question, why do we do CI's for means, proportions, difference and slope and they all tell us the same thing?? or do they?
Thank you JB

MrCitsidas
Автор

Thank you sir!!, excellent explanation for sure!, Salute...all the way from South Africa

mjitape
Автор

Many thanks for the video. That helps me understand "how" x2 is done on p-value from software. On the other hand, by the same token, would y-intercept be rejected in this example? in practical sense, do we check / assume a value for the y-intercept?

yincty
Автор

Excellent explanation without throwing any mumbo jumbo terms. Thanks so much. How about a video on Multiple regression?

Kashmk
Автор

You carried out the Hypothesis test Ho: B1 = 0. How would you do it differently if you wanted to run the test H0: B1 = 1, Ha B1 < 1? 

alexhenry
Автор

You should be a stats prof. You'd make millions.

seans
Автор

Also how do you calculate the standard error of the estimator without having that computer program? 

alexhenry
Автор

Why the t-value is different between calculating confidence interval and testing null hypothesis(2.145 vs 2.820)??

yueyang
Автор

Thank you frof. You make me more interested in statistic! Can you make a video about subsampling and split-plot :)

MrYuiagaraki
Автор

Do you have any video on factorial design?

Chuks
Автор

HELP :)
I was trying to calculate myself the Std. Error from a linear regression with 6 explanatory variables (X1 to X6) and I can't get the same results than the R summary output. I looked into the summary.lm function code, but I freaked out when they start diagonalizing the inverse of the Choleski decomposition. It is like R is using a different and more complex estimation method, perhaps?

This is what I do. I just want to manually calculate it for one of the variables, let's say X3:
*Fitting*
fit1 <- lm(Y ~ ., data = spd.tbl)
print(summary(fit1))
Call:
lm(formula = Y ~ ., data = spd.tbl)

Residuals:
Min 1Q Median 3Q Max
-10.9418 -4.3555 0.3158 5.5425 11.5990

Coefficients:
Estimate Std. Error t value Pr(>|t|)
(Intercept) 10.78708 11.58926 0.931 0.361634
X1 0.61319 0.16098 3.809 0.000903 ***
X2 -0.07305 0.13572 -0.538 0.595594
X3 0.32033 0.16852 1.901 0.069925 .
X4 0.08173 0.22148 0.369 0.715480
X5 0.03838 0.14700 0.261 0.796334
X6 -0.21706 0.17821 -1.218 0.235577
---
Signif. codes: 0 ‘***’ 0.001 ‘**’ 0.01 ‘*’ 0.05 ‘.’ 0.1 ‘ ’ 1

Residual standard error: 7.068 on 23 degrees of freedom
Multiple R-squared: 0.7326, Adjusted R-squared: 0.6628
F-statistic: 10.5 on 6 and 23 DF, p-value: 1.24e-051

*My computations*
Se2= sum(fit1$residuals^2) / fit1$df.residual
SSxx = sum((spd.tbl$X3 - mean(spd.tbl$X3))^2)
SE = sqrt(Se2 / SSxx)
print(SE)
[1] 0.1118252
*(I was expecting 0.16852)*


*Data*
The data comes from the book Regression Analysis by Example by Chatterjee (Table 3.2.) I actually have typed it myself into a csv file:

Row, Y, X1, X2, X3, X4, X5, X6
1, 43, 51, 30, 39, 61, 92, 45
2, 63, 64, 51, 54, 63, 73, 47
3, 71, 70, 68, 69, 76, 86, 48
4, 61, 63, 45, 47, 54, 84, 35
5, 81, 78, 56, 66, 71, 83, 47
6, 43, 55, 49, 44, 54, 49, 34
7, 58, 67, 42, 56, 66, 68, 35
8, 71, 75, 50, 55, 70, 66, 41
9, 72, 82, 72, 67, 71, 83, 31
10, 67, 61, 45, 47, 62, 80, 41
11, 64, 53, 53, 58, 58, 67, 34
12, 67, 60, 47, 39, 59, 74, 41
13, 69, 62, 57, 42, 55, 63, 25
14, 68, 83, 83, 45, 59, 77, 35
15, 77, 77, 54, 72, 79, 77, 46
16, 81, 90, 50, 72, 60, 54, 36
17, 74, 85, 64, 69, 79, 79, 63
18, 65, 60, 65, 75, 55, 80, 60
19, 65, 70, 46, 57, 75, 85, 46
20, 50, 58, 68, 54, 64, 78, 52
21, 50, 40, 33, 34, 43, 64, 33
22, 64, 61, 52, 62, 66, 80, 41
23, 53, 66, 52, 50, 63, 80, 37
24, 40, 37, 42, 58, 50, 57, 49
25, 63, 54, 42, 48, 66, 75, 33
26, 66, 77, 66, 63, 88, 76, 72
27, 78, 75, 58, 74, 80, 78, 49
28, 48, 57, 44, 45, 51, 83, 38
29, 85, 85, 71, 71, 77, 74, 55
30, 82, 82, 39, 59, 64, 78, 39

*Thanks*
I don't understand how the book (equation 3.6) calculates the SE either, that's why I searched for other explanations. In any case, if you have read this far, thanks! :)

MrJegerjeg