filmov
tv
How To Plot Magnitude Spectrum of Audio Signal with Python and Matplotlib | Tutorial for Beginners

Показать описание
✅ Please subscribe to WolfSound to let the little Wolf 🐺 grow:
Hi, my name is Jan Wilczek. I am an audio programmer and a researcher. Welcome to WolfSound!
WolfSound enables everybody to learn about audio programming!
ABOUT THE VIDEO
In digital signal processing (DSP), we often compute the discrete Fourier transform (DFT) of an audio signal, for example, using the Fast Fourier Transform (FFT). This tutorial shows you how to easily display the magnitude of the DFT, the magnitude spectrum, using the Matplolib library in Python.
The script includes examples of how to include decibels full-scale (dBFS) scaling of the magnitude axis and a logarithmic frequency axis for a better interpretability of the graph.
In the video:
✅ Which libraries to use
✅ How to effortlessly compute the FFT of an audio signal
✅ Step-by-step writing of the plot_magnitude_spectrum functions
✅ How to plot the magnitude in decibels full-scale (dBFS)
✅ How to plot the frequency axis logarithmically which corresponds to our perception of pitch
✅ How to mark the frequency axis using the ISO-standardized octave band marks
✅ How to adjust the figure to your needs (colors, labels, font size, markersize and more)
✅ How to export your figure to a .png file with transparent background effortlessly
✅ How to adjust the limits of the plot properly for optimal readability
ABOUT ME
FOLLOW WOLFSOUND ONLINE
TIME CODES
00:00 Introduction
00:40 Installing necessary libraries using a virtual environment
02:12 Reading an example audio file with soundfile
04:07 Calculating the magnitude spectrum (absolute value of the FFT)
07:00 Plot magnitude spectrum with linear magnitude and frequency axis
12:46 How to save the figure as a file
16:20 Plot the magnitude in decibels
21:02 Plot the frequency axis logarithmically
24:44 Bonus: How to easily create audio plugins and musical apps
#audio #python
 0:26:20
How To Plot Magnitude Spectrum of Audio Signal with Python and Matplotlib | Tutorial for Beginners
 0:11:33
The Spectrum: Representing Signals as a Function of Frequency
 0:11:33
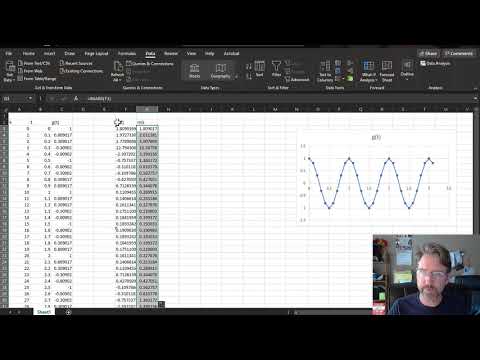
FFT in excel for spectral analysis
 0:21:49
Computing Fourier Transform of given signals. Sketch magnitude and Phase spectra
 0:08:28
How To Plot Fourier Transform in MATLAB (Magnitude Spectrum)
 0:30:56
Magnitude and phase spectrum with example
 0:14:25
DSP#5 Problem to find DFT, Magnitude and phase spectrum || EC Academy
 0:17:44
Magnitude and phase spectrum graphs - Frequency response in signal and system / DSP
 0:10:34
Where are magnitude and phase in the output of the FFT?
 0:14:52
How to Compute FFT and Plot Frequency Spectrum in Python using Numpy and Matplotlib
 0:15:08
Frequency Response Magnitude and Poles and Zeros
 0:09:09
python code Plot the simple waveform, Linear Magnitude Spectrum, Log Magnitude Spectrum of a signal.
 0:19:50
Fourier transform example | Magnitude spectrum | Lect# 2 | signals and systems
 0:05:38
Signals & Systems - Fourier Transforms - working examples - 1 - UNIT II
 0:13:43
Magnitude and phase spectrum graphs
 0:20:44
Understanding Power Spectral Density and the Power Spectrum
 0:05:35
Magnitude n Phase spectrum
 0:19:20
Understanding the Discrete Fourier Transform and the FFT
 0:06:16
Magnitude and Phase Plot of Fourier Series Coefficients Example | Signals and Systems
 0:34:45
DTFT -1| what is Discrete Time Fourier Transform |How to plot Magnitude and Phase Spectrum |Example1
 0:04:05
Electrical Engineering: Ch 18: Fourier Series (11 of 35) The Amplitude Phase Form
 0:03:54
How to find the frequency plot using FFT Fourier Transform function in MATLAB
 0:02:39
Magnitude and Phase Spectrum of FIR digital filter using Hamming Window in MATLAB
 0:08:52
#240 TO OBTAIN FOURIER TRANSFORM OF A SIGNAL AND PLOT ITS MAGNITUDE AND PHASE SPECTRUM
Комментарии