filmov
tv
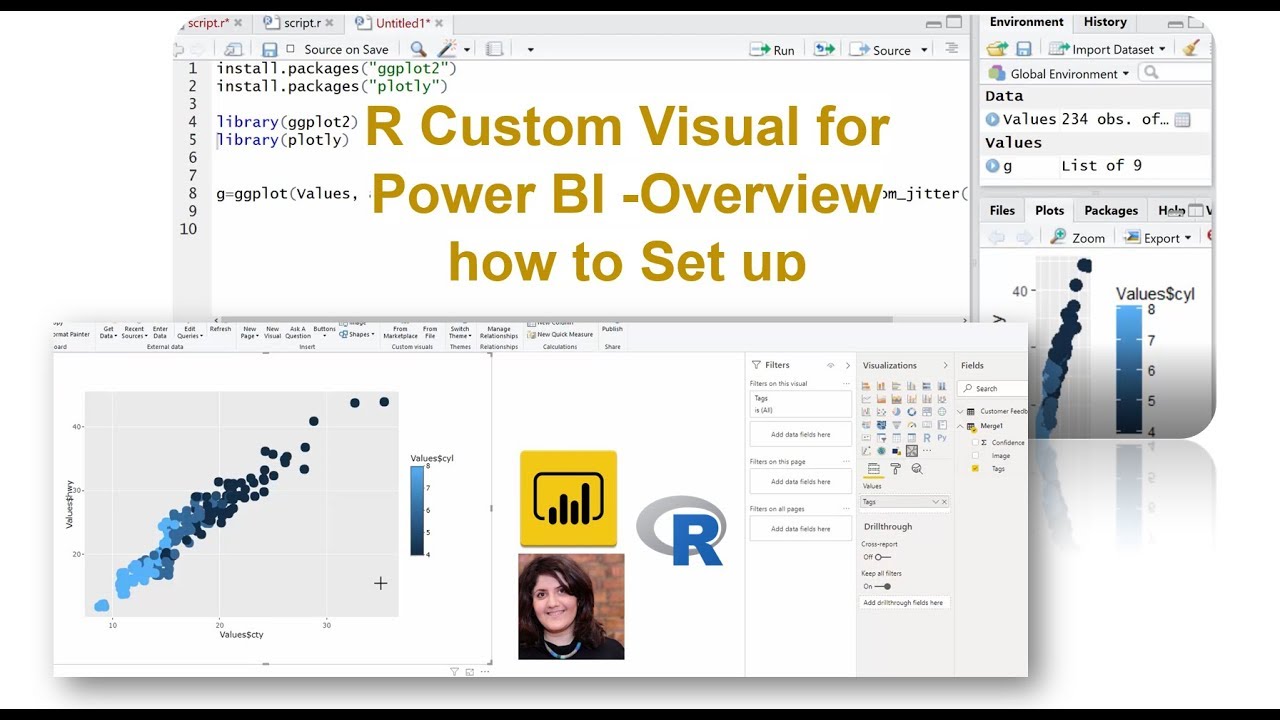
R Custom Visual for Power BI -Overview how to Set up
Показать описание
This is the second part video of Creating Custom Visual using R and JSON for Power BI, in this video where we ale to set up the environment has been explained.
also, the code is here
1- Open R Studio and install below packages
2- check the package availability
library(ggplot2)
library(plotly)
3- Values=mpg
g=ggplot(Values, aes(x=Values$cty, y=Values$hwy,colour = Values$cyl)) + geom_jitter(size=4)
also, the code is here
1- Open R Studio and install below packages
2- check the package availability
library(ggplot2)
library(plotly)
3- Values=mpg
g=ggplot(Values, aes(x=Values$cty, y=Values$hwy,colour = Values$cyl)) + geom_jitter(size=4)
 0:15:41
R Custom Visual for Power BI -Overview how to Set up
 0:05:53
Business Intelligence: Creating R Custom Visualizations for Power BI
 0:14:04
R Custom Visual for Power BI -Update for late 2018 and 2019
 0:04:59
R Visuals in PowerBI for Sports Scientists
 0:04:44
#3 Minutes video, Power BI Custom Visual writting R codes
 0:17:22
How To Create Complex Visuals In Power BI With A Single Line Of Code Using R
 0:03:06
Create an interactive map using R Custom Visuals in Power BI
 0:43:45
Building custom visuals in Power BI using Node.js, R and TypeScript
 0:12:39
Make Better Woodworking and CNC CAM Clamps Using a Free OpenScad Script | Build A CNC Episode 28
 0:00:44
Custom 3d visual using R and PowerBI
 0:56:12
Power BI Custom Visual using R and JSON [Demo]
 0:12:05
Power BI Custom Visuals - Table Sorter | Developing Custom Visuals for Power BI
 0:02:09
Power BI Ultimate Waterfall Chart Custom Visual - IBCS (R)
 0:52:46
R visual in Power BI with pbiviz and ggplot2
 0:04:01
Use R visuals without R knowledge in Power BI - Power BI Tips & Tricks #18
 0:04:04
Power BI R Forecasting Custom Visual
 0:01:36
SNEAK PREVIEW: Power BI Ultimate Variance Chart Custom Visual - IBCS (R)
 0:00:55
Power BI Ultimate Variance Chart Custom Visual - IBCS (R) Release
 0:02:51
Microsoft PowerrBI Custom Visuals Portfolio of Dataviz.Boutique (IBCS (R))
 0:01:04
Power BI Custom Visual Waterfall Teaser IBCS (R)
 0:04:06
Use Custom Visuals in Power BI
 0:51:48
Microsoft Power BI: How to build a custom visual for Power BI - BRK3020
 0:04:10
Business Intelligence: Power BI R Custom Visualizations are now Interactive
 0:03:59
Time Series Decomposition Visual Power BI
Комментарии