filmov
tv
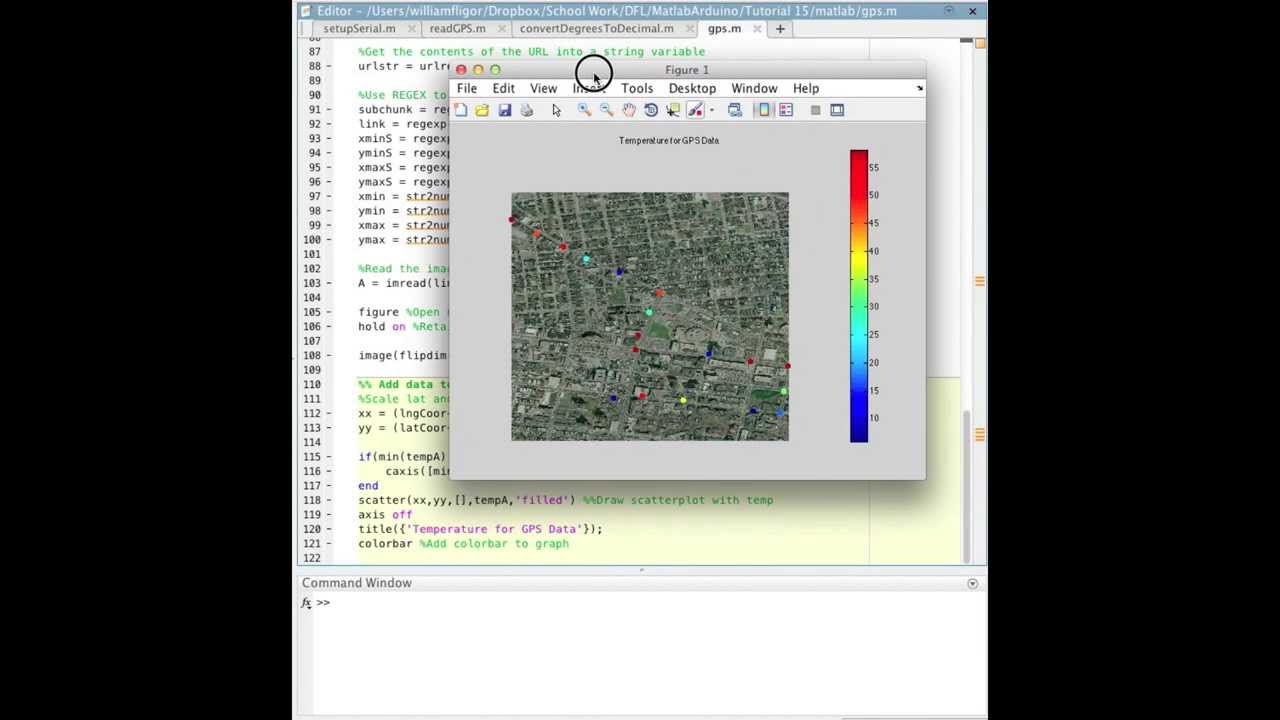
MATLAB Arduino Tutorial 15 - Visualizing Geotagged (GPS) Temperature Data
Показать описание
This video demonstrates how to visualize GPS tagged TI TMP 102 Temperature Sensor data using the Arduino UNO board and MATLAB. The UNO board logs real-time latitude and longitude data using the USGlobalSat EM-406A GPS Module along with the time-stamps. This data is then acquired by MATLAB and displayed on the command window.
Configuration:
- Matlab R2012a
- Arduino 1.0.1
- USB 2.0
- USGlobalSat EM-406A GPS Module
- TI TMP 102 temperature sensor
Configuration:
- Matlab R2012a
- Arduino 1.0.1
- USB 2.0
- USGlobalSat EM-406A GPS Module
- TI TMP 102 temperature sensor
 0:09:10
MATLAB Arduino Tutorial 15 - Visualizing Geotagged (GPS) Temperature Data
 0:12:09
Simulink Tutorial - 15 : How To Interface Arduino Board With MATLAB Simulink?
 0:02:52
MATLAB Arduino Tutorial 18 - 2D Animations in MATLAB using fill() - Scaling and Translation
 0:00:21
AI is getting too smart 💀 #electronics #arduino #engineering
 0:08:09
1. Installing Matlab Arduino support Packages
 0:00:21
STM32F4 Discovery- Arduino Matlab Tutorial 3
 0:00:19
Simple tips for drone making
 0:02:22
Arduino in 100 Seconds
 0:00:13
EV CHARGING STATION MODEL BASED ON PWM DC DC | ELECTRIC VEHICLE | MATLAB SIMULINK | EV CHARGING
 0:00:17
The correct way to use tin soldering iron.
 0:00:16
A RC Drone Made Without a Flight Controller
 0:00:21
Arduino/Matlab interface for analog input reading.
 0:00:08
Matlab/Arduino Blink an LED
 0:00:12
PMSM HIGH FREQUENCY-MATLAB-SIMULINK-PMSM-Permanent magnet synchronous machines-pmsm
 0:00:15
Nonlinear Control for DC Microgrids Enabling Efficient Renewable Power Integration and Ancillary Ser
 0:00:14
Brushless DC Motor (BLDC) modelling with mathematical equations simulink model | MATLAB SIMULINK
 0:00:21
learn Arduino programming in 20 seconds!! (Arduino projects)
 0:00:32
Arduino Project 2 Spaceship Interface MATLAB Script LED Blinking Push Button
 0:00:16
5000KM distance walkie-talkie,you can talk in real time
 0:00:30
MULTI LEVEL INVERTER MATLAB SIMULINK ELECTRICAL SIMULATION
 0:31:14
Arduino with Servo Motors & GSM in MATLAB | Webinar Ep#3 | @MATLABHelper
 0:00:15
9V Battery to Charge charging model
 0:00:14
FPGA (VGA controller) implementation in MATLAB Simulink
 0:00:16
V2G & G2V system Simulink simulation and electric vehicle charging and discharging | Matlab Simu...
Комментарии