filmov
tv
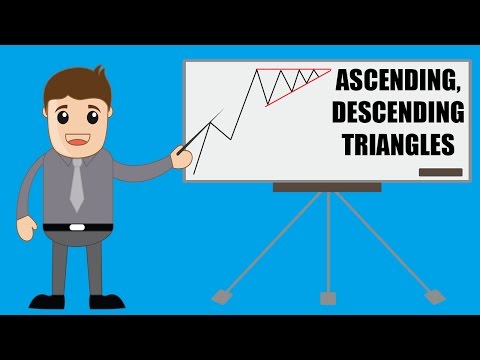
Ascending and Descending Triangles in 2 Minutes

Показать описание
Ascending Triangle Pattern and Descending Triangle pattern is the best representation of who holds the strength in the market.
In this video I will teach you the concept behind the Ascending and Descending Triangles and why you should trade them.
The trading floor is a new project that I just launched.
World class day trading education and tools
FunderPro
Start your funded account challenge HERE (20% discount with link)
For charts Use Trading View
New Official Telegram Group
TMA OFFICIAL®
Looking for a forex broker?
I use Osprey
regulated broker i recommend is Blueberry markets
Try a $100,000 funded account from OspreyFX
Use coupon code
movingaverage50
To get $50 off
Sign up for a $100,000 FTMO funded account here
Get a free audio book from audible
Links to the indicators
TMA Overlay
TMA Divergence indicator
TMA shop
Get some free stocks from WEBULL
also
Get some free stocks from Public
The Triangle Chart pattern is one of the most frequently found Forex patterns on the price charts. Technical traders prefer trading this pattern as it provides greater insight into the future price movement and the upcoming resumption of the current trend. This is a consolidation pattern that occurs in the midway of the trend, and it signals the continuation of the existing trend.
The Triangle pattern is formed between the two converging trend lines as the price temporarily moves into a small range. We must wait for the breakout to happen in an existing trend to take a trade. There are three types of Triangle chart patterns, and they are the Ascending Triangle, Descending Triangle, and The Symmetrical Triangle.
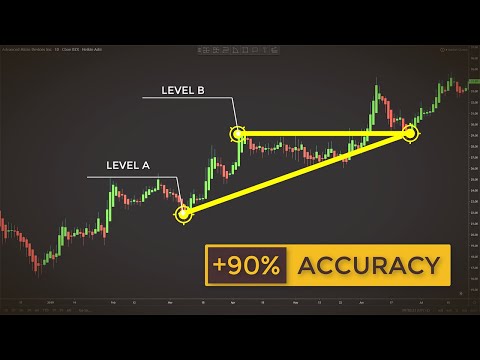
Ascending Triangle
It typically appears in a bullish trend. When the price action breaks the upper horizontal trend line with increased volume, it indicates a buy signal.
Descending Triangle
It is a bearish continuation pattern, and it appears in a downtrend. When the price action breaks the lower horizontal trend line with increased volume, it implies that the original sellers are back in the show, and it is an indication for us to go short.
NOT FINANCIAL ADVICE DISCLAIMER
The information contained here and the resources available for download through this website is not intended as, and shall not be understood or construed as, financial advice. I am not an attorney, accountant or financial advisor, nor am I holding myself out to be, and the information contained on this Website is not a substitute for financial advice from a professional who is aware of the facts and circumstances of your individual situation.
We have done our best to ensure that the information provided here and the resources available for download are accurate and provide valuable information. Regardless of anything to the contrary, nothing available on or through this Website should be understood as a recommendation that you should not consult with a financial professional to address your particular information. The Company expressly recommends that you seek advice from a professional.
*None of this is meant to be construed as investment advice, it's for entertainment purposes only. Links above include affiliate commission or referrals. I'm part of an affiliate network and I receive compensation from partnering websites. The video is accurate as of the posting date but may not be accurate in the future.
descending triangle trading descending triangle strategy ascending triangle trading descending triangle breakout
 0:04:51
Ascending and Descending Triangles in 2 Minutes
 0:14:02
ULTIMATE Triangle Chart Pattern Trading Strategy (Ascending, Descending, Symmetrical)
 0:02:36
How to trade ascending & descending triangles | Understanding Technical Analysis
 0:01:25
Learn Forex - Ascending and Descending triangle formations
 0:09:36
Ascending and Descending Triangle Pattern Strategy
 0:02:38
The Two Chart Patterns all Traders must know | Ascending Triangle/Bullish Pennant
 0:17:46
Das einzige Ascending / Descending Triangle Video welches du gesehen haben musst...! (Chart Pattern)
 0:12:40
How to Day Trade Descending and Ascending Triangles.
 0:18:21
'Triangle Patterns Uncovered: Ascending & Descendin.
 0:14:25
Ascending Triangle Chart Pattern (Trading Strategy)
 0:06:59
How to Trade the Ascending and Descending Triangle Chart Patterns
 0:11:27
Triangle Price Pattern Trading Strategy Guide (Ascending, Descending, Symmetrical)
 0:00:59
Ascending Triangle chart pattern | Bullish reversal pattern | Chart patterns
 0:07:10
How to Trade Symmetrical Triangles like a Pro 💡
 0:11:43
Cryptocurrency: What You Need to Know About Ascending & Descending Triangles
 0:05:19
Ascending & Descending Triangles
 0:09:10
Pure Price Action Series 4 Ascending and Descending Triangle Patterns
 0:10:42
Trading With Ascending Triangles To Find Explosive Breakouts (Forex & Stock Trading Strategy)
 0:06:44
Intro to Technical Analysis | Ascending and Descending Triangles
 0:07:08
5 tips for Ascending and Descending Triangles
 0:09:18
Ascending Triangle And Descending Triangle Price Patterns
 0:31:48
Important crypto chart patterns. Ascending and descending triangles explained to a five year old
 0:01:25
Ascending and Descending Triangle Formations - HelpForex4u
 0:08:19
Ascending, Descending, Symmetrical Triangle Stock Chart Patterns
Комментарии