filmov
tv
QML Profiler within Qt Creator 2.5

Показать описание
This is a short screencast showing the latest features in the QML Profiler UI. The QML Profiler is part of Qt Creator. The version featured in this video corresponds to Qt Creator 2.5, current master branch as of February 2012.
See our post in Qt Labs:
See our post in Qt Labs:
 0:08:51
QML Profiler within Qt Creator 2.5
 0:13:50
Profiling a QML application using qmlprofiler
 0:04:41
Introduction to Qt - Qt For Device Creation – Testing & Profiling {tutorial}
 0:11:44
Qt Debugging & Profiling
 0:02:01
Qml Profiler recording
 0:22:31
QtWS15- The CPU Usage Analyzer for Device Creation, Ulf Herman, The Qt Company
 0:09:20
Debugging inside Qt Creator
 0:01:15
C++ : How to Qt - Qml debugging and/or profiling?
 0:53:52
QtDD12 QML Coding, Performance and Debugging: Usage of Tools - Aurindam Jana
 0:59:51
Qt DevDays 2011, The last mile - Effective Debugging and Profiling for Qt and Qt Quick
 0:13:23
QML Object Serialization - Qt 5 Design Patterns
 0:04:39
Qml Performance Monitor
 0:52:36
QML debugger in Qt Creator tutorial - January 2023 - 2409c95c
 0:55:12
QtDD14 -Using the QML profiler - Ulf Hermann
 0:01:11
Profiling and Debugging (Part 1) - Introduction
 0:03:24
Starting the Application in GammaRay from Qt Creator
 0:30:01
Writing Qt Creator Debugging Helpers
 0:48:20
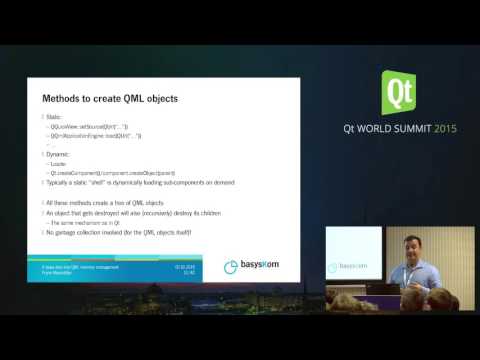
QtWS15- A deep dive into QML memory management internals, Frank Meerkötter, basysKom GmbH
 0:07:46
GammaRay Tutorials (Part 8) - How to visualize Qt Quick Batching and Overdrawing
 0:52:02
QtDD14 -Analyzing Performance of QtQuick Applications - Thomas McGuire
 0:01:14
GammaRay: Finding Bugs and Performance Issues in Qt / QML Applications
 0:27:32
C++ and QML Code Coverage | Tools | #QtWS21
 0:02:29
QT Creator - Debugging with qDebug()
 0:50:04
GammaRay: Taking a deep look into your Qt application - Volker Krause
Комментарии