filmov
tv
R tutorial: Lattice tutorial, how to make a grouped bar chart, part 1

Показать описание
Here's my tutorial on how to make a lattice grouped bar chart, or bar plot. In this video, you'll learn how to make a grouped bar chart that shows the number of Prix de Lausanne ballet dances that were choreographed by men, and the number that were choreographed by women.
Steps:
1. Put your data into Excel into the right format. This is a bit tricky.
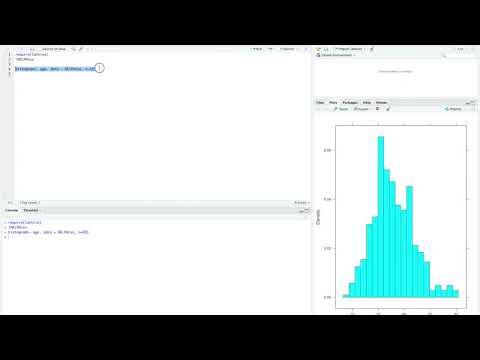
2. Import lattice into R
4. Set up the x, y, and and groups in the bar chart. Make sure to make horizontal = FALSE, or you'll get a horizontal bar chart.
Ta da! You have the core of a barchart. Next video, you'll learn how to make it look nice.
IDE: RStudio
Main packages: lattice
Main function: barchart
Steps:
1. Put your data into Excel into the right format. This is a bit tricky.
2. Import lattice into R
4. Set up the x, y, and and groups in the bar chart. Make sure to make horizontal = FALSE, or you'll get a horizontal bar chart.
Ta da! You have the core of a barchart. Next video, you'll learn how to make it look nice.
IDE: RStudio
Main packages: lattice
Main function: barchart
 0:21:19
R tutorial: Lattice tutorial, how to make a grouped bar chart, part 1
 0:03:57
R Tutorial: Data Visualization with lattice in R
 0:37:13
R tutorial: Lattice tutorial, how to make a grouped bar chart, part 2
 0:07:03
Advanced plotting in R (part 1): formulas and lattice
 0:05:00
R Programming Data Visualization Lattice
 0:19:17
3.1: Graphics: base, lattice, ggplot2 - Introduction to R Workshop
 0:06:23
Lattice System part 1 HD 720p
 0:04:03
Tutorial R: Paquete Lattice
 0:07:33
R Lattice Graphics Histograms
 0:03:40
Draw Multiple lattice Plots in One Window in R (Example) | Plot Grid Using gridExtra & grid.arra...
 0:10:54
Lattice Package in R language
 0:23:16
Lattice Graphs in R
 2:06:40
IDEMI 2: Visualization in R, Basis plot, Lattice plot, ggplot
 0:06:23
igraph tutorials. Colouring networks in R. Barabasi Albert network and lattice network
 0:04:04
Balanced lattice designs in R software
 0:08:11
R Lattice Graphics Scatter Plots
 0:06:07
ANALYSE ALPHA LATTICE DESIGN USING RSTUDIO
 0:04:23
Balanced and Partially Balanced Lattice Designs: Analysis of Variance
 0:03:58
Alpha Lattice Design Analysis using RStudio
 0:15:20
Lattice
 0:05:20
Generating an Alpha Lattice Design in FielDHub
 0:14:05
Alpha lattice design over location analysis on # R software
 0:13:36
How to use lattice visualization package in R
 0:07:18
Intro R: Lattice
Комментарии