filmov
tv
Chartbrew Preview - Open Source Data Visualization and Client Reporting

Показать описание
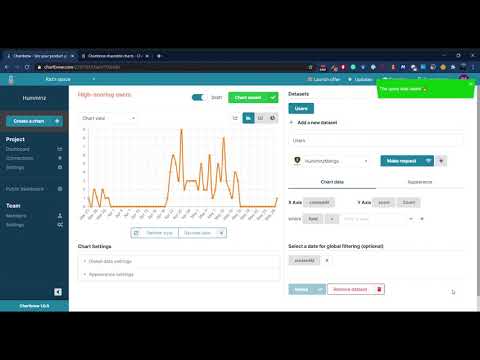
This video presents the main features of Chartbrew. At the moment of recording, the version of the platform was v1.21.0
Chartbrew is an open source visualization platform where you can multiple data sources to create live dashboards and client reports. Here are a few links to get started:
Chartbrew is an open-source web application that can connect directly to databases and APIs and use the data to create beautiful charts. It features a chart builder, editable dashboards, embeddable charts, query & requests editor, and team capabilities.
Charbrew integrations (head over to the website for an up-to-date list):
Some of Chartbrew's features
* Reports branding and white-labeling
* Templates support - choose from ones already created for you or even create your own to re-use across your dashboards
* Auto-update schedule for your dashboards
* Chart embedding
* Shareable reports
* Data filters at dashboard-level or chart level
* Public data filters - available to viewers
* Excel and PDF exports
* Granular permissions for your team and clients
 0:12:26
Chartbrew Preview - Open Source Data Visualization and Client Reporting
 0:17:22
ChartBrew v3 Overview Data Visualize Modern Charts and Graphs Open Source version, Hosted Version
 0:01:01
Chartbrew v2 Launch Video
 0:00:26
New! Set up email alerts for your charts with Chartbrew 📧
 0:10:41
Chartbrew v3 preview - What's new - Coming January 2024
 0:07:57
Chartbrew v3 - Getting started
 0:03:37
Chartbrew Plugin | Episode 1
 0:00:35
Automate Your Insights with Chartbrew's Dashboard Update Scheduler!
 0:07:37
Chartbrew - Get started with the new Strapi plugin
 0:06:09
Chartbrew Plugin | Episode 8
 0:07:09
Chartbrew Plugin | Episode 2
 0:08:14
Chartbrew Plugin | Episode 9
 0:10:23
Feature showcase: Chartbrew Customer.io Integration Campaign Metrics Charts
 0:03:14
Quick intro to Chartbrew - Creating a MongoDB dashboard
 0:10:53
Chartbrew Plugin | Episode 6
 0:03:48
Chartbrew Plugin | Episode 4
 0:04:13
5 Hottest Open Source Data Visualization Tools of 2022
 0:10:50
Chartbrew Plugin | Episode 7
 0:08:56
Chartbrew Plugin | Episode 5
 0:04:15
Chartbrew Plugin | Episode 3
 0:11:20
ANSELM: Open-Source Framework for Data Analytics and Data Visualization
 0:01:28
STAgile Dashboards
 0:01:21
7 Best Free And Open Source Dashboard Software
 0:06:01
The Problem with Open-Source Dashboarding Tools
Комментарии