filmov
tv
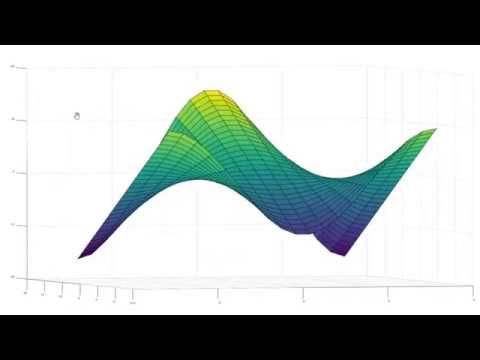
MATLAB/@GnuOctave Tutorial - 03 Plotting Data and Graphics

Показать описание
Learn how to plot data using different styles, manipulate axis labels, title, legend, make colorful 3D surface plots, also 2D bitmap graphics.
Based on MATLAB R2015a Primer:
This is less of a MATLAB/GNU Octave Math Programming Language "tutorial" and more of a learning-by-sharing video. :)
Help us caption & translate this video!
Based on MATLAB R2015a Primer:
This is less of a MATLAB/GNU Octave Math Programming Language "tutorial" and more of a learning-by-sharing video. :)
Help us caption & translate this video!
 0:51:59
 0:17:56
 0:38:55
 0:02:18
![[Matlab/Octave] Unit Sample](https://i.ytimg.com/vi/SvHKttUEU8k/hqdefault.jpg) 0:01:31
0:01:31
 0:02:14
![[Matlab/Octave] Step Sequence](https://i.ytimg.com/vi/d9HtMTVdARg/hqdefault.jpg) 0:05:09
0:05:09
 0:18:31
 0:12:09
![[Matlab/Octave] Unit Sample](https://i.ytimg.com/vi/j03Yn3qqmD0/hqdefault.jpg) 0:02:16
0:02:16
 0:12:37
 0:09:47
 0:03:46
![[Matlab/Octave] Unit Sample](https://i.ytimg.com/vi/UIIlNkOD24I/hqdefault.jpg) 0:05:02
0:05:02
 0:10:32
 0:03:10
 0:01:39
 0:09:13
 0:19:32
![[Matlab/Octave] Sinusoidal Plot](https://i.ytimg.com/vi/hqwXa4BNQYA/hqdefault.jpg) 0:01:43
0:01:43
 0:08:56
 0:09:41
 0:06:28
 0:01:30