filmov
tv
Python Tutorial : Using pandas with Seaborn

Показать описание
---
Data scientists commonly use Pandas to perform data analysis, so it's a huge advantage that Seaborn works extremely well with Pandas data structures. Let's see how this works!
Pandas is a python library for data analysis.
It can easily read datasets from many types of files including csv and txt files.
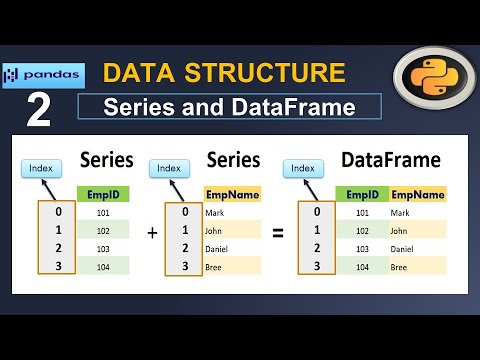
Pandas support several types of data structures, but the most common one is the DataFrame object. When you read in a dataset with Pandas, you will create a DataFrame.
Let's look at an example. First, import the Pandas library as "pd".
Then, use the "read_csv" function to read the csv file named "masculinity dot csv" and create a Pandas DataFrame called "df".
Calling "head" on the DataFrame will show us its first five rows. This dataset contains the results of a survey of adult men. We can see that it has four columns: "participant_id"; "age"; "how_masculine", which is that person's response to the question "how masculine or 'manly' do you feel?"; and "how_important", which is the response to the question "how important is it to you that others see you as masculine?"
Now let's look at how to make a count plot with a DataFrame instead of a list of data.
The first thing we'll do is import Pandas, Matplotlib and Seaborn as we have in past examples. Then, we'll create a Pandas DataFrame called "df" from the masculinity csv file.
To create a count plot with a Pandas DataFrame column instead of a list of data, set x equal to the name of the column in the DataFrame - in this case, we'll use the "how_masculine" column. Then, we'll set the data parameter equal to our DataFrame, "df".
After calling "plt dot show", we can see that we have a nice count plot of the values in the "how_masculine" column of our data. This plot shows us that the most common response to the question "how masculine or 'manly' do you feel?" is "somewhat", with "very" being the second most common response. Note also that because we're using a named column in the DataFrame, Seaborn automatically adds the name of the column as the x-axis label at the bottom.
Let's pause for an important note here. Seaborn works great with Pandas DataFrames, but only if the DataFrame is "tidy". "Tidy data" means that each observation has its own row and each variable has its own column. The "masculinity" DataFrame shown here is tidy because each row is a survey response with one answer to each survey question in each column. Making a count plot with the "how masculine" column works just like passing in a list of that column's values.
In contrast, here is an example of an "untidy" DataFrame made from the same survey on masculinity. In this untidy DataFrame, notice how each row doesn't contain the same information. Row 0 contains the age categories, rows 1 and 7 contain the question text, and the other rows contain summary data of the responses. This will not work well with Seaborn. Unlike the tidy DataFrame, values in the "Age" column don't look like a list of age categories for each observation.
Transforming untidy DataFrames into tidy ones is possible, but it's not in scope for this course. There are other DataCamp courses that can teach you how to do this.
Now it's time to try out using Pandas with Seaborn!
#DataCamp #PythonTutorial #DataVisualizationwithSeaborn
 0:13:31
LEARN PANDAS in about 10 minutes! A great python module for Data Science!
 1:00:27
Complete Python Pandas Data Science Tutorial! (Reading CSV/Excel files, Sorting, Filtering, Groupby)
 0:20:52
Basic Guide to Pandas! Tricks, Shortcuts, Must Know Commands! Python for Beginners
 1:34:11
Complete Python Pandas Data Science Tutorial! (2024 Updated Edition)
 0:10:08
What is Pandas? Why and How to Use Pandas in Python
 0:18:18
Learn how to use PANDAS in Python in 15 minutes - with 10 real examples
 0:23:06
Pandas for Data Science in 20 Minutes | Python Crash Course
 4:57:59
Pandas & Python for Data Analysis by Example – Full Course for Beginners
 0:00:52
Effortlessly Clean Your Dataset with Pandas in 60 Seconds! #DataScience #Pandas #Shorts
 0:22:50
Learning Pandas for Data Analysis? Start Here.
 0:25:25
Pandas Python tutorial | Python Tutorial for Beginner | Python Programming | Great Learning
 0:17:42
Pandas Tutorial Italiano 🧑🏻💻 Python per la Data analysis e Data Science 📊 Diventa Data Analyst!...
 0:50:59
Introdução ao Pandas no Python - [SAIA DO ZERO EM 1 AULA]
 1:05:24
Python Pandas Tutorial in Hindi
 0:16:59
SQL Databases with Pandas and Python - A Complete Guide
 0:40:22
Exploratory Data Analysis with Pandas Python
 0:05:55
NumPy vs Pandas
 1:13:18
Learn Python Pandas: 1-Hour Pandas Course for Beginners
 4:22:13
Data Analysis with Python - Full Course for Beginners (Numpy, Pandas, Matplotlib, Seaborn)
 0:22:09
Merging DataFrames in Pandas | Python Pandas Tutorials
 0:15:52
Python Pandas Tutorial : Series and DataFrame Basics #2
 0:16:50
Creating Visualizations using Pandas Library | Python Pandas Tutorials
 0:26:46
Pandas Dataframe Tutorial | Dataframe In Pandas | Python Pandas Tutorial | Python Basics|Simplilearn
 0:32:13
Exploratory Data Analysis in Pandas | Python Pandas Tutorials
Комментарии