filmov
tv
Descriptive Statistics for Categorical Data - Statistics with SPSS 27 for Beginners (4 of 8)

Показать описание
Dr. Daniel, Diva, and Desi explain categorical variables and show you how to display them in tables, as numbers, and with graphs.
You learn the correct choices for describing categorical data using the Dog Toys dataset and the FREQUENCIES menu in SPSS. We create frequency tables and bar charts then interpret them. Next, we use the CROSSTABS command to display two categorical variables, after recoding one of them to make the groups more easily comparable. Finally, we interpret both the cross-table and the chi-square statistic to look for differences between categorical variables.
▀▀▀▀▀▀▀▀▀▀▀▀▀▀▀▀▀▀▀▀▀▀▀▀▀▀
Chapters
0:00 Introduction – Dr. Daniel & Diva the Pomeranian
0:53 Download the data file
1:27 Explaining Categorical data w/ Desi the Pomeranian
4:49 Examining the Dog Toys dataset for categorical variables
5:52 Descriptive statistics for a categorical variable
6:36 Options for descriptive statistics in SPSS
7:55 The FREQUENCIES menu in SPSS
12:13 Bar Charts for displaying categorical variables
12:53 Editing a bar chart with the Chart Editor
15:04 Pie Charts…and why not to use them
16:31 Descriptive statistics for TWO categorical variables CROSSTABS
19:30 Recoding categorical variables
22:20 Interpreting descriptive statistics
23:15 Review of what we learned
▀▀▀▀▀▀▀▀▀▀▀▀▀▀▀▀▀▀▀▀▀▀▀▀▀▀
Statistics Instructors: you are free to link to this video and the playlist for your seated or online statistics course or for other educational purposes.
Music
Fate And Luck Version C
Intro - See Me On Top Version B
Outro - Hard Jack
This series uses IBM SPSS Statistics 27.0.1
Edited in Camtasia 2020
▀▀▀▀▀▀▀▀▀▀▀▀▀▀▀▀▀▀▀▀▀▀▀▀▀▀
To download, hover your cursor over the file icon and a blue download icon will appear. You do not need to request access to a file.
 0:05:52
Descriptive Statistics for Categorical Data
 0:24:42
Descriptive Statistics for Categorical Data - Statistics with SPSS 27 for Beginners (4 of 8)
 0:26:46
Descriptive Statistics for Categorical Data in Business Statistics (Week 3A)
 0:02:24
Descriptive Statistics for Categorical Data in SPSS
 0:05:18
Descriptive Statistics for Categorical Variables
 0:03:12
How to Run Descriptive Statistics for an Ordered Categorical Variable in Excel
 0:00:13
Mode of Categorical Data - Intro to Descriptive Statistics
 0:10:55
Nominal, Ordinal, Interval & Ratio Data: Simple Explanation With Examples
 10:09:44
Statistics using R part 73
 0:11:18
Descriptive Statistics for CATEGORICAL Data in JASP (WK3e)
 0:18:18
Descriptive Statistics and Graphs for Categorical Variables | Stata Tutorial
 0:04:24
Descriptive Statistics for Categorical Variables Using SPSS
 0:08:04
Descriptive Statistics for One Categorical Variable
 0:02:45
Descriptive analysis for categorical and numerical data
 0:13:34
Categorical Data I: Proportions testing | Z test | Chi Squared test
 0:11:09
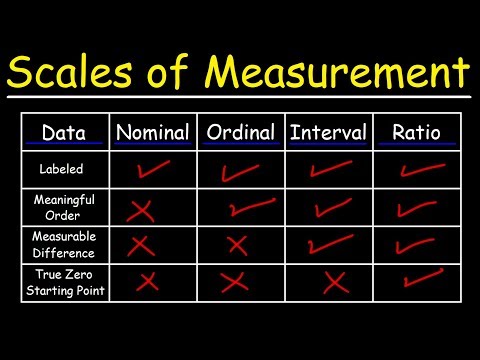
Scales of Measurement - Nominal, Ordinal, Interval, & Ratio Scale Data
 0:27:36
Descriptive Statistics: Frequency Distribution Using MS Excel for Categorical Data.
 0:06:03
Introduction to Descriptive Statistics
 0:28:14
Quantitative Data Analysis 101 Tutorial: Descriptive vs Inferential Statistics (With Examples)
 0:08:53
Analyzing trends in categorical data | Probability and Statistics | Khan Academy
 0:05:34
R Tutorials for Beginners: Descriptive Statistics for Univariate Categorical Variables
 0:11:08
CHAPTER 2: DESCRIPTIVE STATISTICS | SECTION 1 SUMMARIZING CATEGORICAL DATA
 0:00:12
Mode of Categorical Data - Intro to Descriptive Statistics
 0:00:16
Standard deviation for categorical variables: don’t do this!
Комментарии