filmov
tv
Voyager 1 PWS electron plasma oscillations beyond the heliopause

Показать описание
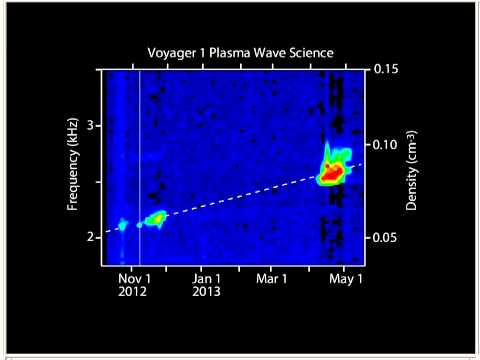
This animation combines two ways of displaying the Voyager Plasma Wave Science (PWS) observations of electron plasma oscillations which provide the basis for concluding that the spacecraft is now in interstellar space. The graphic is called a spectrogram that shows the amplitude of waves (in which reds are the most intense and blues the least intense) as a function of frequency (vertical axis) and time (horizontal axis). In many respects, this spectrogram is like a voice print which shows the evolution of the spectrum of sounds as a function of time. The sound track reproduces the amplitude and frequency of the plasma waves observed. The vertical white bar that moves across the spectrogram links the sound track to the graphic.
The frequency range shown from about 1.75 kiloHertz to 3.5 kiloHertz is a portion of the actual frequency range detected by PWS and is well within the audio frequency range. Importantly, the frequency is directly related to the number of electrons per unit volume in the vicinity of Voyager and corresponds to about 1 electron per 10 cubic centimeters or a cube about 1 inch on a side. The time scale for this presentation represents 225 days or a bit more than 7 months, while it only takes about 12 seconds to play the audio file. Hence, the time compression is about 1.6 million to one. It should be noted that this compression was done in such a way as to not change the frequencies.
In this animation, there are two events of interest. In the October-November 2012 time frame there is a tone near 2.1 kHz which gradually increases in frequency. Again, in the April-May 2013 time frame there is another event, somewhat more intense and at a higher frequency near 2.6 kHz. We conclude that these two events indicate an ongoing trend to higher frequencies. The second graphic frame which appears in the animation includes a dashed line showing this increase in frequency and suggests that the density of electrons is continually increasing over this time interval as Voyager moves outwards from the heliopause (which was crossed on 25 August 2012).
 0:00:25
Voyager 1 PWS electron plasma oscillations beyond the heliopause
 0:00:18
Voyager 1 PWS Continuation of Shock-Associated Signals
 0:00:25
Voyager 1 PWS electron plasma oscillations beyond the heliopause
 0:04:36
Voyager's 'Interstellar Plasma Music' Composed By Sun | Video
 0:01:02
Voyager Captures Sounds of Interstellar Space
 0:00:44
Voyager Captures Video of Interstellar Space
 0:00:30
edited exspanded audio of voyager 1 plasma wave data
 0:00:23
Sounds of Dense Plasma in Interstellar Space: Voyager 1's Captivating Discovery
 0:00:10
Voyager 1 Detects Hum From Ionized Interstellar Gas As It Exits The Solar System
 0:00:18
Update on Voyager 1 interstellar signals
 0:00:49
Voyager 1 hangs on the solar system's 'heliocliff'
 0:02:09
Voyager 1 Records 'Sounds' From Interstellar Space | Video
 0:00:38
First ever interstellar sound recorded | Voyager 1 #Shorts
 0:00:58
Voyager 1 sets distance record on February 17, 1998
 0:10:37
NASA WARNS: Voyager 1 Has Detected Something Strange Beyond the Kuiper Belt
 0:01:22
NASA's Voyager 1 captures sounds of interstellar space
 0:03:46
Sound of INTERSTELLAR MISSION - Voyager 2 | SOUND OF SPACE (Procedural art, FFT Processing)
 0:04:27
Voyager 1 detects faint, monotone hum beyond our solar system.
 0:01:06
Scary sound of interstellar Space captured by NASA's Voyager 1 Space probe
 0:00:23
Deep Space
![[SONS DA NASA]](https://i.ytimg.com/vi/WiFnkf9x7oo/hqdefault.jpg) 0:00:13
0:00:13
[SONS DA NASA] #34 Voyager: Sons de Plasma Interestelar
 0:07:17
Historical Audio Recordings: Voyager 1 Spacecraft
 0:01:32
Voyager 1 recorded New hmm sounds from outer solar system
 0:00:04
The CME that Confirmed Voyager 1 had Left the Heliosphere
Комментарии