filmov
tv
Neural Architecture Search without Training (Paper Explained)
Показать описание
#ai #research #machinelearning
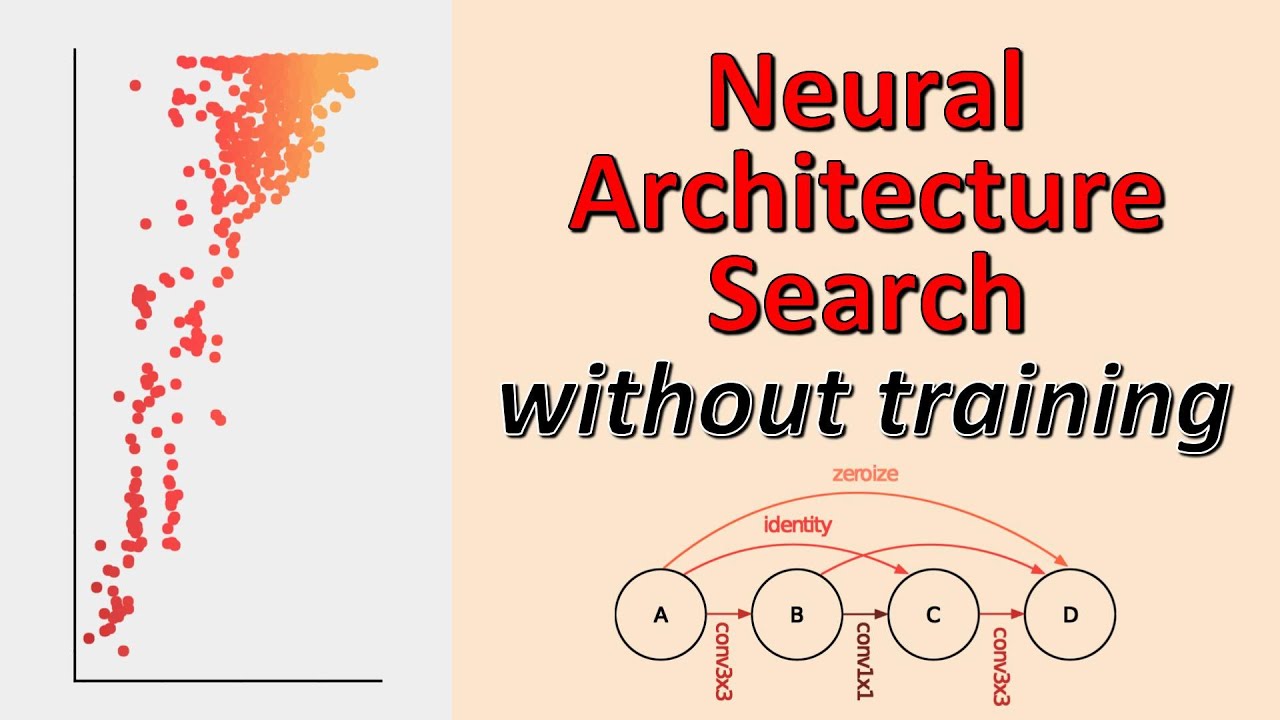
Neural Architecture Search is typically very slow and resource-intensive. A meta-controller has to train many hundreds or thousands of different models to find a suitable building plan. This paper proposes to use statistics of the Jacobian around data points to estimate the performance of proposed architectures at initialization. This method does not require training and speeds up NAS by orders of magnitude.
OUTLINE:
0:00 - Intro & Overview
0:50 - Neural Architecture Search
4:15 - Controller-based NAS
7:35 - Architecture Search Without Training
9:30 - Linearization Around Datapoints
14:10 - Linearization Statistics
19:00 - NAS-201 Benchmark
20:15 - Experiments
34:15 - Conclusion & Comments
Abstract:
The time and effort involved in hand-designing deep neural networks is immense. This has prompted the development of Neural Architecture Search (NAS) techniques to automate this design. However, NAS algorithms tend to be extremely slow and expensive; they need to train vast numbers of candidate networks to inform the search process. This could be remedied if we could infer a network's trained accuracy from its initial state. In this work, we examine how the linear maps induced by data points correlate for untrained network architectures in the NAS-Bench-201 search space, and motivate how this can be used to give a measure of modelling flexibility which is highly indicative of a network's trained performance. We incorporate this measure into a simple algorithm that allows us to search for powerful networks without any training in a matter of seconds on a single GPU. Code to reproduce our experiments is available at this https URL.
Authors: Joseph Mellor, Jack Turner, Amos Storkey, Elliot J. Crowley
Links:
If you want to support me, the best thing to do is to share out the content :)
If you want to support me financially (completely optional and voluntary, but a lot of people have asked for this):
Bitcoin (BTC): bc1q49lsw3q325tr58ygf8sudx2dqfguclvngvy2cq
Ethereum (ETH): 0x7ad3513E3B8f66799f507Aa7874b1B0eBC7F85e2
Litecoin (LTC): LQW2TRyKYetVC8WjFkhpPhtpbDM4Vw7r9m
Monero (XMR): 4ACL8AGrEo5hAir8A9CeVrW8pEauWvnp1WnSDZxW7tziCDLhZAGsgzhRQABDnFy8yuM9fWJDviJPHKRjV4FWt19CJZN9D4n
 0:35:06
Neural Architecture Search without Training (Paper Explained)
 0:08:32
How to Perform Neural Architecture Search with no Training
 0:00:47
DSNAS: Direct Neural Architecture Search Without Parameter Retraining
 0:13:57
BIⱯS Reading Group | Neural Architecture Search without Training | Sunisth
 0:01:00
Neural Architecture Search for Lightweight Non-Local Networks
 0:22:10
State of the Art Neural Networks - Neural architecture search (NAS)
 0:00:06
Easy AI Concepts: Neural Architecture Search (NAS) #ai
 0:13:32
Neural Architecture Search Explained
 0:10:31
Neural Architecture Search
 0:19:22
NEURAL ARCHITECTURE SEARCH WITH REINFORCEMENT LEARNING
 1:37:39
Introduction to Neural Architecture Search
 0:09:22
ENAS | Lecture 15 (Part 2) | Applied Deep Learning (Supplementary)
 0:10:06
Network Architecture Search: AutoML and others
 1:14:17
EfficientML.ai Lecture 7 - Neural Architecture Search (Part I) (MIT 6.5940, Fall 2023)
 0:23:58
Efficient Neural Architecture Search Part 2 - Testing
 0:19:36
Zero-Cost Proxies: How to find the best neural network without training (Ep. 201)
 1:04:01
Lecture 07 - Neural Architecture Search (Part I) | MIT 6.S965
 0:17:11
BANANAS: Bayesian Optimization with Neural Architectures for Neural Architecture Search
 0:02:56
NNI v2.2 - Neural Architecture Search with Retiarii - One-shot NAS
 0:43:39
Mohamed Abdelfattah | 'Fast and Hardware-Aware Neural Architecture Search'
 0:21:52
Neural Architecture Search
 0:31:15
Neural Architecture Search (NAS) evaluation is frustratingly hard (Paper Explained)
 0:11:57
Hierarchical Neural Architecture Search
 1:13:45
tinyML Talks: Neural Architecture Search for Tiny Devices
Комментарии