filmov
tv
Data Visualization Jobs

Показать описание
DATA VISUALIZATION JOBS // Data visualization is a popular and growing skillset to have. As the amount of data available has exploded, it’s become more critical to make sure we can communicate it in a meaningful way. That’s where data visualization comes in. In this video, I’ll look at skills needed for data visualization jobs and how to incorporate data visualization into your current job.
Data visualization jobs, like most other roles, can take many different forms. Some of these roles are more dedicated design roles. Think graphic designer who is solely focused on the communication of a predetermined message. These people aren’t doing any analysis themselves, they’re illustrating what’s already been analyzed and determined. Many of the data visualizations you see on or in the news are done by people who aren’t doing any analysis or doing minimal analysis work themselves.
On the other end of the spectrum are data visualization jobs where the visualization is a large part of the actual analysis. These types of roles fall into the data analytics sphere. Jobs that require extensive Tableau, Power BI, DOMO, or Qlik Sense expertise fall into this category. While these tools CAN be used just to create graphics, the majority of the time they’re used to actually analyze the data as well.
💡 RESOURCES FROM JEN
🧰 OTHER RESOURCES:
💬 CONNECT WITH ME:
#dataanalyst #datascience
* This is an affiliate link. At no additional cost to you, I will earn a commission if you decide to make a purchase after clicking through the link. I only promote products I have investigated and feel deliver value.
 0:04:11
Data Visualization Jobs
 0:02:11
Data Visualization Career Path
 0:07:12
How to tell if a career in Data Analytics is right for you...
 0:25:39
How Self-Employed Data Visualization Designers Make a Living
 0:08:57
How I'd become a data analyst (if i had to start over) in 2024
 0:10:55
FASTEST Way to Become a Data Analyst and ACTUALLY Get a Job
 0:13:58
day in the life of a Business Analyst at Spotify| how I visualize data (in 3 steps)
 0:13:47
How to Become a Freelance Data Analyst in 2024
 0:00:16
10+ Professional courses II Online Training II Certification II 30% Discount II Interview Assistance
 0:00:37
How to get Data Analytics side jobs - NEW LinkedIn Feature
 0:13:24
DATA VISUALIZATION TOOLS | Career in Data Visualization | Data Analytics Jobs | Good Career Option
 0:04:22
How to Make Money from Data Visualization? | Zeeshan Usmani
 0:05:26
Top 5 jobs with high salary in Data Visualization -Data Analyst/Data Scientist/Data Visualization
 0:07:39
The Harsh Reality of Being a Data Analyst
 0:14:39
10 PORTFOLIO PROJECTS TO ADD TO YOUR DATA PORTFOLIO
 0:01:00
Data Engineer vs Data Scientist #shorts
 0:03:33
Data visualization specialist // IT job - HIRING // Jobs in Japan #43
 0:02:25
What Are The Different Jobs Within Data Analytics?
 0:04:18
What Does a Data Analyst Actually Do?
 0:11:02
Data Visualization in 2024 | The Ultimate Guide
 0:04:08
Data Analytics - The 9 Essential Tools! (2024)
 0:00:48
How I'd Learn to Become a Data Analyst
 0:09:33
PROJECTS that landed Data Jobs for my Subscribers
 0:00:31
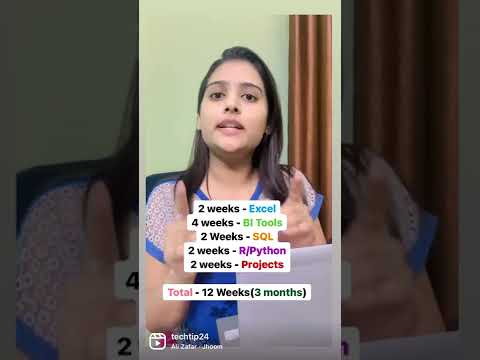
Data Analytics 3 months roadmap #dataanalytics #datascience #upgradeskill #livetraining
Комментарии