filmov
tv
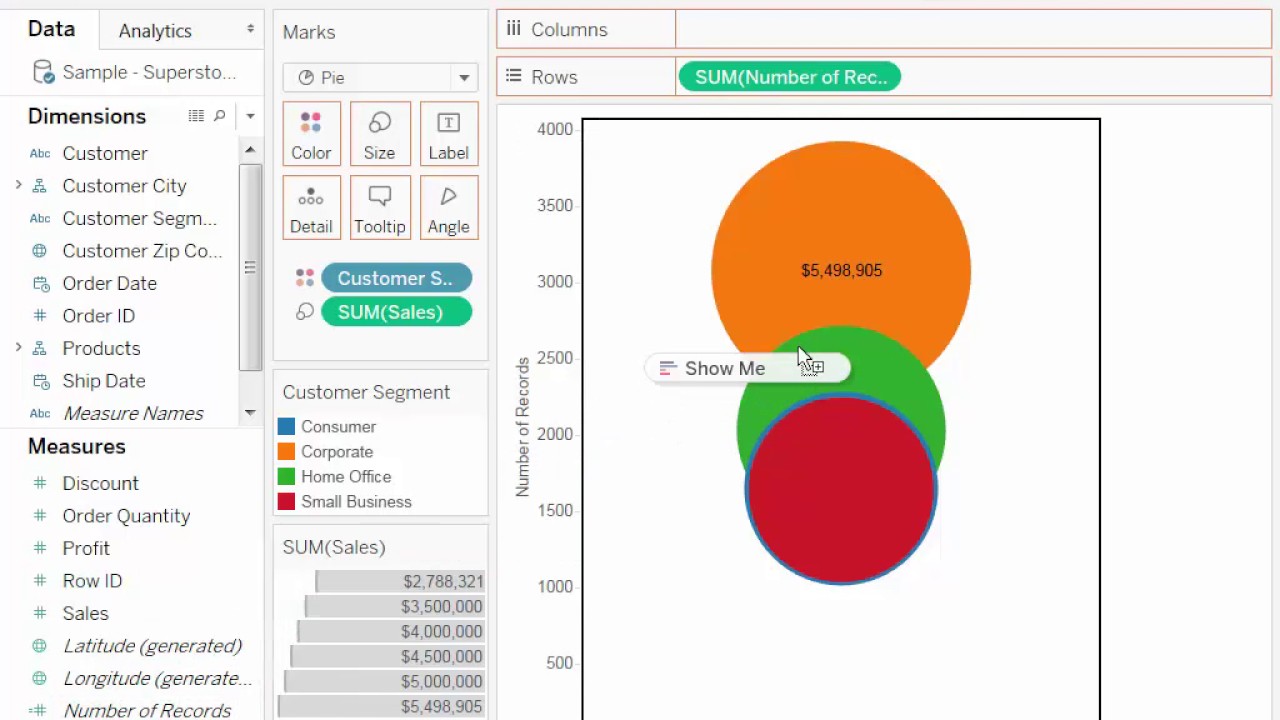
How to create a Doughnut chart in Tableau
Показать описание
In this silent video, you'll learn how to create doughnut charts.
- - - - - - - - - - - - - -
Option 1: Use Two Pie Charts
1. Create a pie chart
2. Switch to the dual-axis chart
3. Change the second pie chart to a circle
Option 2: Use One Pie Chart and an Image File
You can also create a pie chart as in Step 1 above, add it to a dashboard, and place a circular .png image over the middle.
- - - - - - - - - - - - - -
- - - - - - - - - - - - - -
Option 1: Use Two Pie Charts
1. Create a pie chart
2. Switch to the dual-axis chart
3. Change the second pie chart to a circle
Option 2: Use One Pie Chart and an Image File
You can also create a pie chart as in Step 1 above, add it to a dashboard, and place a circular .png image over the middle.
- - - - - - - - - - - - - -
 0:00:46
 0:10:34
 0:00:33
 0:00:34
 0:00:59
 0:03:10
 0:00:27
 0:04:36
 0:00:31
 0:08:09
 0:00:59
 0:01:01
 0:00:18
 0:04:52
 0:01:01
 0:00:15
 0:00:22
 0:12:31
 0:00:16
 0:00:55
 0:00:22
 0:06:19
 0:00:34
 0:00:59