filmov
tv
Understanding Spectrum Analyzers – Noise Figure

Показать описание
This video provides a brief technical introduction to noise figure measurements using a spectrum analyzer and the Y-factor method.
Timeline:
00:00 Introduction
00:13 About signal-to-noise ratio (SNR)
01:05 Ideal device
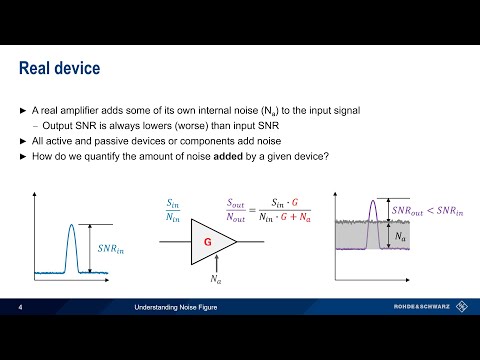
01:43 Real device
02:28 Defining noise figure
03:09 About noise figure (NF)
04:06 Measuring noise figure
05:15 The Y factor method
06:04 Two steps in the Y factor method
06:46 Details of the Y factor method
08:03 Additional NF measurement topics
08:29 About noise sources and ENR
09:56 About preamplifiers and NF measurements
10:54 About noise figure measurement uncertainty
11:58 About cascaded noise figure
13:28 Summary
Timeline:
00:00 Introduction
00:13 About signal-to-noise ratio (SNR)
01:05 Ideal device
01:43 Real device
02:28 Defining noise figure
03:09 About noise figure (NF)
04:06 Measuring noise figure
05:15 The Y factor method
06:04 Two steps in the Y factor method
06:46 Details of the Y factor method
08:03 Additional NF measurement topics
08:29 About noise sources and ENR
09:56 About preamplifiers and NF measurements
10:54 About noise figure measurement uncertainty
11:58 About cascaded noise figure
13:28 Summary
 0:14:53
Understanding Spectrum Analyzers – Noise Figure
 0:11:31
Understanding Basic Spectrum Analyzer Operation
 0:03:20
R&S FSW Signal and Spectrum Analyzer, Measuring noise figure and gain
 0:14:19
Understanding Phase Noise Fundamentals
 0:09:21
Understanding Phase Noise - the Spectrum Analyzer Method
 0:08:59
Understanding Spectrum Analyzers – DANL
 0:10:21
How to use a Spectrum Analyzer; techniques, controls, test methods, hints & tips
 0:12:29
Measuring Noise Figure using a Spectrum Analyzer - The Gain Method
 0:03:05
How to Measure a Spectrum Analyzer's Phase Noise
 0:09:14
Understanding Spectrum Analyzers - Dynamic Range
 0:15:55
Measuring system noise
 0:06:02
Don't Make This Mistake When Mixing With Spectrum Analyzers
 0:02:57
Measuring Phase Noise with a Spectrum Analyzer
 0:13:54
How To Mix With a Spectrum Analyser - SPAN Tutorial
 0:16:40
#1542 Measuring Phase Noise
 0:03:26
What is signal and what is noise?
 0:07:04
Measuring At / Below Signal Analyzer Noise Floor | EXA Signal Analyzer with Multi-touch UI |Keysight
 0:03:12
#582b Resolution Bandwidth and Noise Floor in Spectrum Analyzers
 0:13:04
Analyzing Phase Noise with FSx-K40
 0:13:48
Analyzing Phase Noise with the FSWP
 0:16:11
Signal to Noise Explained in plain English. | Ham Radio For Dummies K6UDA Radio
 0:06:14
How to Measure the Noise Floor of Your Signal Analyzer
 0:01:22
What is a power spectrum?
 0:10:04
INTERCEPT ANY RADIO SIGNAL!!!!
Комментарии