filmov
tv
'Performance Matters' by Emery Berger

Показать описание
Performance clearly matters to users. For example, the most common software update on the AppStore is "Bug fixes and performance enhancements." Now that Moore's Law has ended, programmers have to work hard to get high performance for their applications. But why is performance hard to deliver?
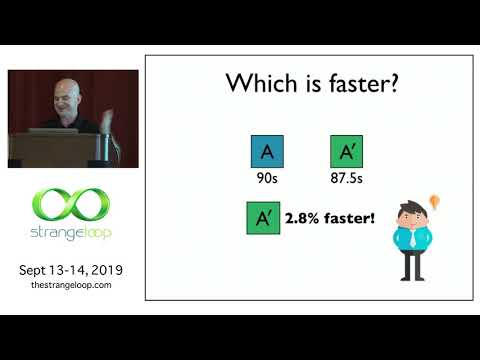
I will first explain why current approaches to evaluating and optimizing performance don't work, especially on modern hardware and for modern applications. I then present two systems that address these challenges. Stabilizer is a tool that enables statistically sound performance evaluation, making it possible to understand the impact of optimizations and conclude things like the fact that the -O2 and -O3 optimization levels are indistinguishable from noise (sadly true).
Since compiler optimizations have run out of steam, we need better profiling support, especially for modern concurrent, multi-threaded applications. Coz is a new "causal profiler" that lets programmers optimize for throughput or latency, and which pinpoints and accurately predicts the impact of optimizations. Coz's approach unlocks previously unknown optimization opportunities. Guided by Coz, we improved the performance of Memcached (9%), SQLite (25%), and accelerated six other applications by as much as 68%; in most cases, this involved modifying less than 10 lines of code and took under half an hour (without any prior understanding of the programs!). Coz now ships as part of standard Linux distros (apt install coz-profiler).
Emery Berger
University of Massachusetts Amherst
@emeryberger
Emery Berger is a Professor in the College of Information and Computer Sciences at the University of Massachusetts Amherst, the flagship campus of the UMass system. He graduated with a Ph.D. in Computer Science from the University of Texas at Austin in 2002. Professor Berger has been a Visiting Scientist at Microsoft Research (where he is currently on sabbatical), the University of Washington, and at the Universitat Politècnica de Catalunya (UPC) / Barcelona Supercomputing Center (BSC). Professor Berger's research spans programming languages, runtime systems, and operating systems, with a particular focus on systems that transparently improve reliability, security, and performance. He and his collaborators have created a number of influential software systems including Hoard, a fast and scalable memory manager that accelerates multithreaded applications (used by companies including British Telecom, Cisco, Crédit Suisse, Reuters, Royal Bank of Canada, SAP, and Tata, and on which the Mac OS X memory manager is based); DieHard, an error-avoiding memory manager that directly influenced the design of the Windows 7 Fault-Tolerant Heap; and DieHarder, a secure memory manager that was an inspiration for hardening changes made to the Windows 8 heap. His honors include a Microsoft Research Fellowship, an NSF CAREER Award, a Lilly Teaching Fellowship, the Distinguished Artifact Award for PLDI 2014, Most Influential Paper Awards at OOPSLA, PLDI, and ASPLOS, three CACM Research Highlights, a Google Research Award, a Microsoft SEIF Award, and Best Paper Awards at FAST, OOPSLA, and SOSP; he was named an ACM Distinguished Member in 2018. Professor Berger is currently serving his second term as an elected member of the SIGPLAN Executive Committee; he served for a decade (2007-2017) as Associate Editor of the ACM Transactions on Programming Languages and Systems, and was Program Chair for PLDI 2016.
 0:42:15
'Performance Matters' by Emery Berger
 0:38:51
'Python Performance Matters' by Emery Berger (Strange Loop 2022)
 1:01:09
Plenary: Performance Matters - Emery Berger - CppCon 2020
 0:59:56
CppCast Episode 267: Performance Matters with Emery Berger
 0:14:18
Python Performance Matters: Emery Berger | Adobe Tech Summit 2022
 0:59:40
SYSTOR 2017 - Prof. Emery Berger - 'Performance Matters'
 1:04:48
'Performance (Really) Matters' with Emery Berger
 1:21:24
Performance Really Matters
 0:25:41
TALK / Emery Berger / Scalene: A high-performance, high-precision CPU+GPU+memory profiler for Python
 0:03:45
01 Why Performance Matters
 0:36:10
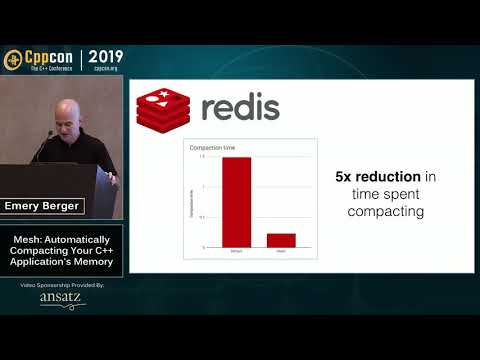
CppCon 2019: Emery Berger “Mesh: Automatically Compacting Your C++ Application's Memory”
 0:09:51
Grading/Importing Data Using Performance Matters
 0:19:41
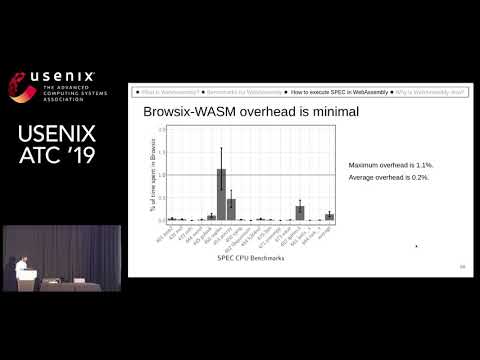
USENIX ATC '19 - Not So Fast: Analyzing the Performance of WebAssembly vs. Native Code
 0:58:41
How To Get Your Research Adopted - Emery Berger PLDI 2022 keynote
 0:22:21
Denys Mishunov: Why Performance Matters - JSConf Budapest 201
 0:17:06
Performance Matters Teacher Training
 0:25:00
Scalene: a high-performance, high-precision CPU+GPU+memory profiler for Python (PyCon US 2021)
 1:05:41
Programming Technology for the Sciences - Prof. Emery Berger (UMass)
 1:03:42
Measuring Multiple Facets of Python Performance With Scalene | Real Python Podcast #172
 0:48:03
Ask Me Anything with Michelle Strout, hosted by Emery Berger
 0:29:01
Powered by AI: A Cambrian Explosion for C++ Software Development Tools - Emery Berger - CppCon 2023
 0:52:20
On the Correctness of Spreadsheets - Emery Berger
 0:14:54
OSDI '23 - Triangulating Python Performance Issues with SCALENE
 0:22:31
AnyDSL: A Partial Evaluation Framework for Programming High-Performance Libraries
Комментарии