filmov
tv
Venn and Euler Diagrams

Показать описание
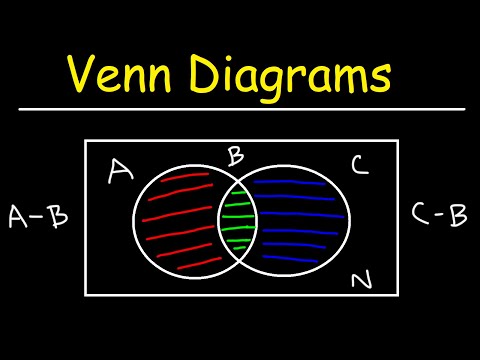
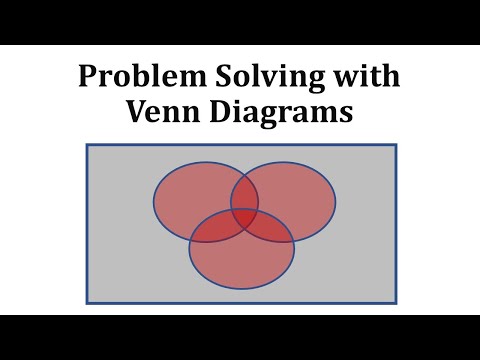
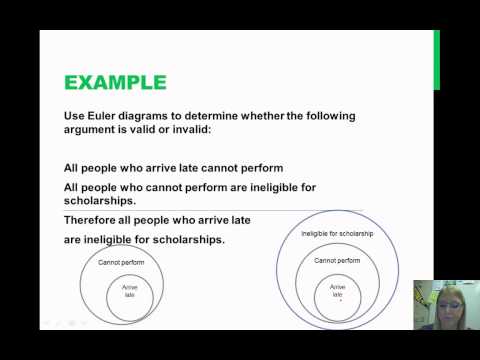
This video describes a new procedure in Statgraphics 19 that creates set diagrams displaying the relative frequency of discrete events. They consist of circular regions that represent the frequency of specific events, where the overlap of the circles indicates the simultaneous occurrence of more than one event.
 0:09:51
 0:05:36
 0:08:03
 0:13:49
 0:11:53
 0:14:05
 0:00:24
 0:04:41
 0:06:06
 0:07:32
 0:00:06
 0:28:50
 0:05:00
 0:04:24
 0:00:31
 0:00:27
 0:03:08
 0:00:30
 0:08:11
 0:18:39
 0:03:55
 0:03:26
 0:03:24
 0:11:06