filmov
tv
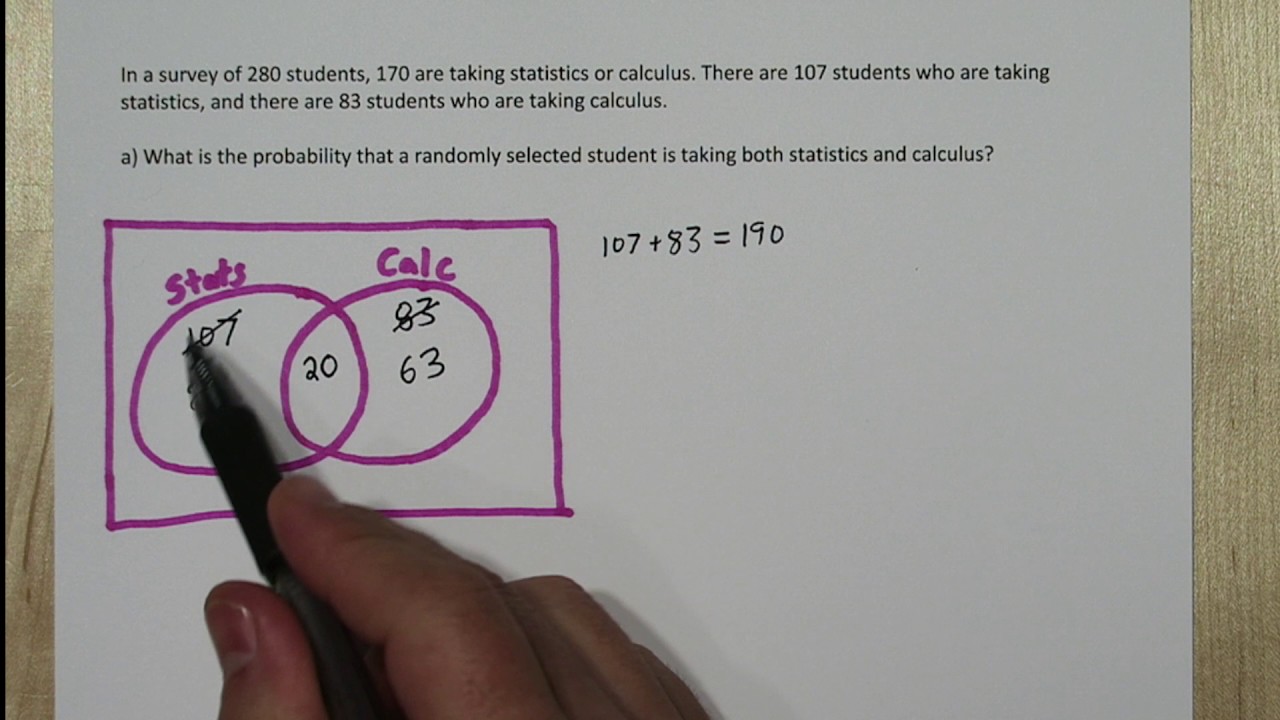
Venn Diagrams: Conditional Probability & Mutually Exclusive
Показать описание
We start by making a venn diagram to represent chance process (probability of a randomly selected student taking calculus or statistics). We also make a two-way table. We then calculate the probability that a student is taking both statistics AND calculus. Next we see that two events are not mutually exclusive if their union has a probability not equal to 0.
 0:16:26
 0:12:23
 0:00:35
 0:06:14
 0:05:17
 0:02:38
 0:03:47
 0:00:36
 0:06:28
 0:07:37
 0:11:01
 0:00:43
 0:00:24
 0:06:15
 0:00:44
 0:03:52
 0:31:52
 0:17:06
 0:06:29
 0:19:14
 0:05:49
 0:04:33
 0:09:40
 0:00:35