filmov
tv
Hypothesis Testing: Calculations and Interpretations| Statistics Tutorial #13 | MarinStatsLectures

Показать описание
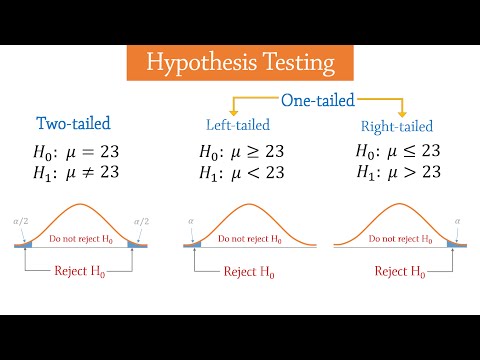
In this statistics video lecture, we discuss the process of testing a hypothesis, using a One Sample t test (Student’s t test). We will define the null and alternative hypothesis, alpha or significance values and p-values. We will work through calculating a hypothesis test for the mean and the interpretations of a hypothesis test (interpreting significant results). We also stress the importance of providing a confidence interval along with a hypothesis test.
We will focus on the concepts, and not the calculations.
►► Watch More:
Follow MarinStatsLectures
Our Team:
Content Creator: Mike Marin (B.Sc., MSc.) Senior Instructor at UBC.
Producer and Creative Manager: Ladan Hamadani (B.Sc., BA., MPH)
These videos are created by #marinstatslectures to support some statistics courses at the University of British Columbia (UBC) (#IntroductoryStatistics and #RVideoTutorials ), although we make all videos available to the everyone everywhere for free.
Thanks for watching! Have fun and remember that statistics is almost as beautiful as a unicorn!
#statistics #rprogramming
 0:04:00
Hypothesis Testing - Introduction
 0:13:34
Hypothesis Testing Problems - Z Test & T Statistics - One & Two Tailed Tests 2
 0:16:22
Hypothesis Testing: Calculations and Interpretations| Statistics Tutorial #13 | MarinStatsLectures
 0:08:07
What is a hypothesis test? A beginner's guide to hypothesis testing!
 0:23:41
Intro to Hypothesis Testing in Statistics - Hypothesis Testing Statistics Problems & Examples
 0:07:58
P-values and significance tests | AP Statistics | Khan Academy
 0:00:51
Hypothesis Testing 🔥 Explained in 60 Seconds
 0:00:13
Ho Vs H1 (Hypothesis Testing Rules 2022) #Shorts (Must Watch Playlists)@AsadInternationalAcademy
 0:03:21
Multiple Comparison Tests | Applied Biostatistics | BIO733_Topic156
 0:01:59
Statistical Significance, the Null Hypothesis and P-Values Defined & Explained in One Minute
 0:08:06
Multiple Regression | Coefficients – Interpretation, C.I, Hypothesis Testing
 0:06:52
Hypothesis Testing - Null and Alternative Hypotheses
 0:05:41
One Tailed and Two Tailed Tests, Critical Values, & Significance Level - Inferential Statistics
 0:17:48
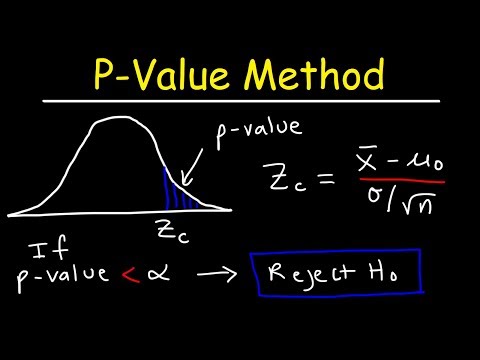
P-Value Method For Hypothesis Testing
 0:12:50
Statistics made easy ! ! ! Learn about the t-test, the chi square test, the p value and more
 0:19:54
How To Know Which Statistical Test To Use For Hypothesis Testing
 0:14:41
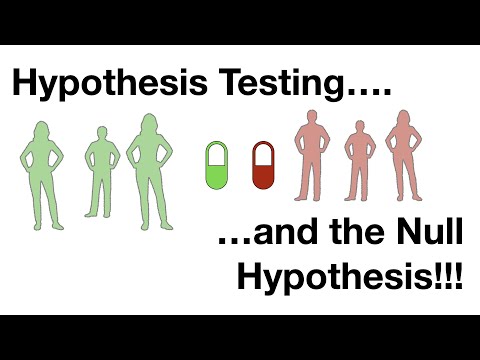
Hypothesis Testing and The Null Hypothesis, Clearly Explained!!!
 0:11:21
p-values: What they are and how to interpret them
 0:08:58
t-tests and p values
 0:00:16
Hypothesis Testing with ANOVA
 1:47:05
QA{ HYPOTHESIS TESTING CLASS 1 REACH US THROUGH 0723579332
 0:13:56
What is Hypothesis Testing ? Math, Statistics for data science, machine learning
 0:06:35
p-Value (Statistics made simple)
 0:00:13
Research Aptitude Part-8 | Types Of Hypothesis | Parametric & Non-Parametric Test | Nta Net Pape...
Комментарии