filmov
tv
Confidence interval of difference of means | Probability and Statistics | Khan Academy

Показать описание
Confidence Interval of Difference of Means
Missed the previous lesson?
Probability and statistics on Khan Academy: We dare you to go through a day in which you never consider or use probability. Did you check the weather forecast? Busted! Did you decide to go through the drive through lane vs walk in? Busted again! We are constantly creating hypotheses, making predictions, testing, and analyzing. Our lives are full of probabilities! Statistics is related to probability because much of the data we use when determining probable outcomes comes from our understanding of statistics. In these tutorials, we will cover a range of topics, some which include: independent events, dependent probability, combinatorics, hypothesis testing, descriptive statistics, random variables, probability distributions, regression, and inferential statistics. So buckle up and hop on for a wild ride. We bet you're going to be challenged AND love it!
About Khan Academy: Khan Academy offers practice exercises, instructional videos, and a personalized learning dashboard that empower learners to study at their own pace in and outside of the classroom. We tackle math, science, computer programming, history, art history, economics, and more. Our math missions guide learners from kindergarten to calculus using state-of-the-art, adaptive technology that identifies strengths and learning gaps. We've also partnered with institutions like NASA, The Museum of Modern Art, The California Academy of Sciences, and MIT to offer specialized content.
For free. For everyone. Forever. #YouCanLearnAnything
Subscribe to KhanAcademy’s Probability and Statistics channel:
 0:15:49
Confidence interval of difference of means | Probability and Statistics | Khan Academy
 0:05:34
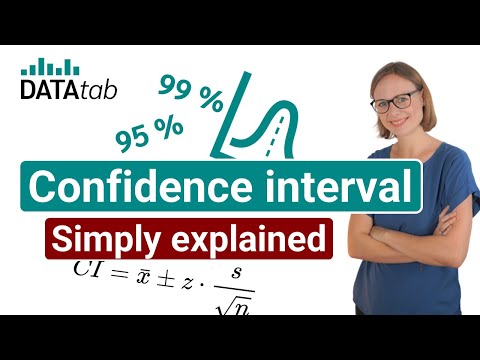
Confidence Interval [Simply explained]
 0:04:50
Calculating confidence interval for difference of means | AP Statistics | Khan Academy
 0:05:03
Confidence Interval vs Confidence Level || The difference and how to use them
 0:05:14
Confidence interval - Difference between 2 means (raw data)
 0:20:40
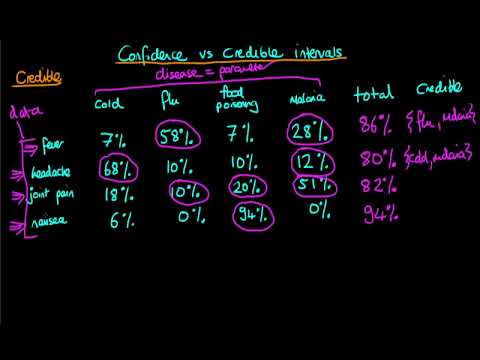
Explaining the difference between confidence and credible intervals
 0:05:41
Calculating a confidence interval for the difference of proportions | AP Statistics | Khan Academy
 0:10:56
Confidence Interval: The right and wrong way to understand them.
 0:03:36
Anthony Smith vs Dominick Reyes|Fight Prediction
 0:08:43
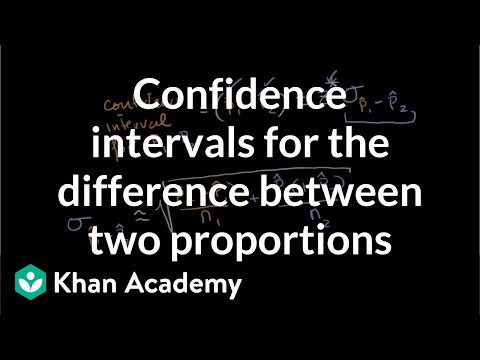
Confidence intervals for the difference between two proportions | AP Statistics | Khan Academy
 0:06:59
How To...Calculate the Confidence Interval for a Sample
 0:02:41
Clarification of confidence interval of difference of means | Khan Academy
 0:10:07
Confidence Intervals vs. Prediction Intervals
 0:06:21
Inference for Two Means: Introduction
 0:11:45
Confidence intervals and margin of error | AP Statistics | Khan Academy
 0:02:48
Interpreting Confidence Intervals EXPLAINED in 3 Minutes with Examples
 0:07:25
Why Confidence Intervals are better than P-values
 0:20:35
How To Find The Z Score, Confidence Interval, and Margin of Error for a Population Mean
 0:04:31
Confidence Interval for a population mean - σ known
 0:08:53
Confidence Interval for Population Means in Statistics
 0:05:05
Confidence Interval for the Difference in Two Population Means
 0:05:36
The Relationship Between Confidence Intervals and Hypothesis Tests
 0:04:30
Confidence Intervals Explained (Calculation & Interpretation)
 0:09:46
Confidence interval for a mean with paired data | AP Statistics | Khan Academy
Комментарии