filmov
tv
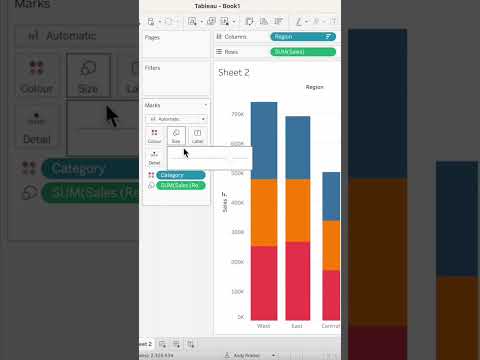
Excel Today - Tableau Graphs and Charts

Показать описание
Excel Today - Tableau Graphs and Charts
For ad free training and certificates please join Learnit Anytime:
Welcome to Learnit's weekly program Excel Today.
Each week we will cover the top trends in office applications and software. We will have interviews with experts, live Q&A, and tips and tricks seminars!
This week: We return after a long hiatus with all things Tableau
#TRAINING #LEARNIT #TABLEAU
 0:36:00
Excel Today - Tableau Graphs and Charts
 0:31:29
Excel Today - Tableau
 0:55:26
How to 'Excel' with Tableau
 0:37:52
How to 'Excel' with Tableau
 0:57:10
How to 'Excel' with Tableau (repeated)
 0:02:23
Using Excel as a Tableau Data Source - Tableau in Two Minutes
 0:53:56
How to 'Excel' with Tableau
 0:16:11
Learn Tableau in 15 minutes and create your first report (FREE Sample Files)
 1:55:45
Power BI Dashboard Mastery | End-to-End Project for Beginners (2023-24)🚀Power BI Dashboard Creation!...
 0:00:39
How to Show Month Over Month Difference As a Percentage in Tableau
 0:02:09
Tableau - create bar chart from excel file
 0:01:00
#Tableau - Butterfly Chart
 0:00:39
#Tableau - Proportional Stacked Bar Chart
 0:04:53
Replicating an Excel Pivot Table in Tableau - Tableau in Two Minutes
 0:00:33
How to create a pie chart using multiple measures in Tableau
 0:15:59
How to Make the BEST Gantt Chart in Excel (looks like Microsoft Project!)
 0:00:58
#Tableau - Why you need Context filters
 0:07:03
Tableau - Actions Filter
 0:00:51
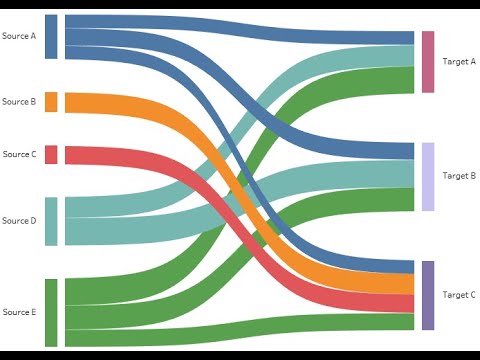
Tableau Mini Tutorial: Creating Sankey Chart in One Minute
 0:01:57
Tableau Tutorial 88 - How to Quickly Copy Chart Data Like a Tableau Pro and Export in Excel
 0:07:47
How to visualize Excel data in Tableau
 0:24:30
Daily Sales Dashboard in Excel
 0:00:59
Tableau vs Power BI 🔥 Right Visualisation Tool for Career Growth | Epic Battle of Data Science 03
 0:04:12
Create a Gantt Chart in Tableau
Комментарии