filmov
tv
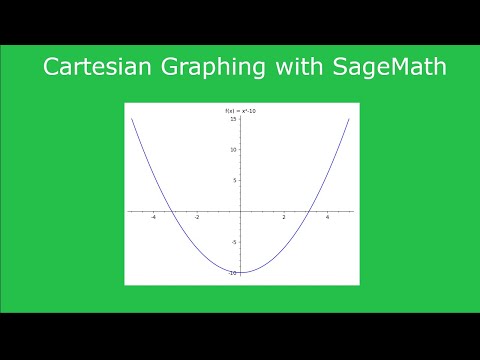
Graphing with SageMath (Sage) on an X/Y Axis for Beginners

Показать описание
Introductory tutorial on Cartesian graphing using SageMath (a/k/a Sage). Discussion of how to use SageMath's plot() to graph a mathematical function, customize the look of your graph (color, title, etc.) with different "options" in plot(), store your graph in a variable and use it later in your program, plot multiple lines on the same graph, and save your graph to your files as a PDF or other format. No prior knowledge of Python or SageMath is assumed. Timestamps are below.
"Mathematical" vs. "Programming" Functions - 1:48
Intro to plot() in SageMath - 3:51
"Options" (keyword arguments) with plot() - 6:42
--xmin and xmax - 7:56
--color - 10:51
--linestyle - 13:07
--title - 13:41
Storing Your Graph Inside a Variable - 14:47
Plotting Multiple Lines on the Same Graph - 18:39
Saving our Graph as a PDF (Or Other Format) - 20:16
 0:25:51
Graphing with SageMath (Sage) on an X/Y Axis for Beginners
 0:42:49
Graph Theory with SageMath Tutorial
 0:33:28
Tutorial 2: Represent Graphs in SageMath
 0:36:44
2d Plotting with SageMath
 0:02:46
sagemath plotting
 0:10:20
plot3d command
 0:06:58
Making Plots in Sage
 1:03:25
Interactive Visualization in SageMath by Julian Rüth
 0:10:35
Plotting of graphs using sagemath (V-3)
 1:21:09
SageMath 2018 Day 1 Session 2: Graph Theory in SageMath and Introduction to Programming
 0:42:57
Intro to SageMath (Sage) - Tutorial for Beginners
 0:45:08
Matplotlib Cartesian Graphing with SageMath Tutorial
 0:33:39
3d Plotting with SageMath
 2:10:45
Using SageMath in Graph Theory
 0:21:48
SageMath plotting demo
 0:27:13
Tutorial 1: SageMath in 10 Minutes
 1:12:51
SageMath: Lecture 2
 1:00:43
SageMath 2018: Day 1 Session 3: Plotting Functions
 0:05:54
V03 | Plotting functions and fields | SageMath
 0:03:54
Simple Plotting in Sage
 0:05:45
SageMathCloud - 2D Plotting
 0:06:40
Differential Equations in Sage - Part 1
 0:49:29
2014 05 21 - An Introduction to Graph Theory in Sage
 0:01:59
Polar plot in sage math
Комментарии