filmov
tv
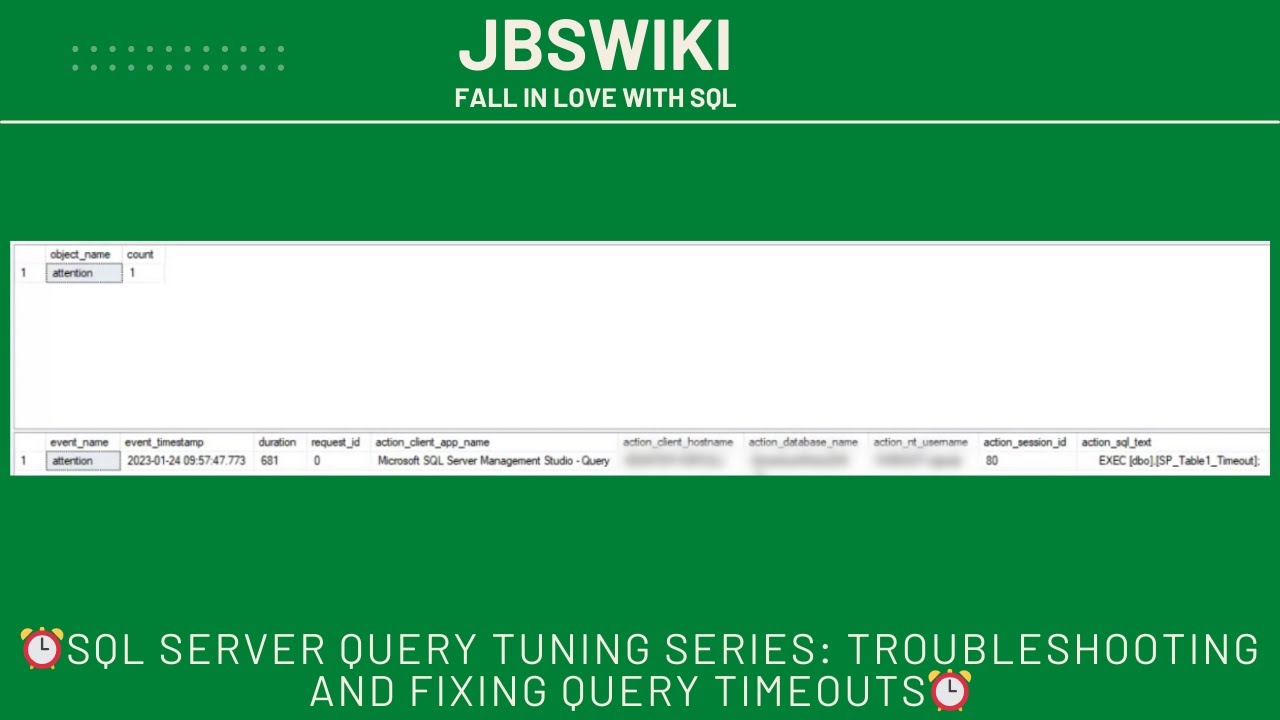
⏰SQL Server Query Tuning Series: Troubleshooting and Fixing Query Timeouts⏰
Показать описание
What Is a Query Timeout? ⏰
Before we jump into the solutions, let's define query timeout 📝. A query timeout occurs when a SQL command, such as a SELECT, UPDATE, INSERT, or DELETE query, takes too long to execute and the system halts the operation after a predefined amount of time. This predefined time is known as the command timeout setting.
Most of the time, query timeouts are not caused by SQL Server itself but by application-level settings. A typical example is a .NET application with ADO.NET, where the default CommandTimeout property is set to 30 seconds. If your SQL query doesn't finish within that timeframe, it raises a timeout exception.
Common Command Timeout Scenarios 💡:
Slow queries caused by inefficient indexing or query design.
High concurrency with multiple queries vying for server resources.
Network latency in distributed or cloud environments.
Hardware limitations such as disk I/O bottlenecks or insufficient memory.
Step-by-Step Guide to Troubleshooting Query Timeouts 🛠️
To troubleshoot and fix query timeouts effectively, you need a structured approach. Here’s how to diagnose and resolve timeout issues:
1. Identifying the Timeout Source 🔍
The first step in fixing query timeouts is identifying where the timeout is coming from. Is it a client-side issue (like in an application), or is SQL Server itself struggling to complete the operation?
A. Check Application-Level Timeout Settings 🖥️
In applications such as .NET, Java, or Python, check the CommandTimeout or QueryTimeout properties.
In ADO.NET, for instance, the default command timeout is set to 30 seconds:
SqlCommand.CommandTimeout = 30;
In Entity Framework:
context.Database.CommandTimeout = 180; // 180 seconds
Ensure your application settings align with the expected query duration.
B. SQL Server-Side Timeout ⏱️
2. Query Execution Plan Analysis 📊
The execution plan is your best friend when tuning SQL queries. It reveals how SQL Server processes a query and can point out bottlenecks like table scans, missing indexes, or inefficient joins.
Use the Execution Plan in SQL Server Management Studio (SSMS):
Click on "Include Actual Execution Plan" before running your query.
Look for red flags like Table Scans (👀 large tables being scanned without using indexes).
Check if Nested Loops or Hash Joins are slowing down the query.
Tips to Analyze Execution Plan 💡:
Cost: Check the relative cost of each operation. High-cost operations might indicate a slow part of the query.
Indexes: Check if the query is using indexes properly. Missing or non-optimized indexes can cause a Table Scan, leading to timeouts.
Joins: Complex joins between large tables can lead to poor performance. Consider breaking the query into smaller chunks or optimizing the join logic.
3. Optimizing Slow Queries 🚀
Now that you’ve identified which part of the query is causing the issue, it’s time to optimize it:
A. Index Optimization 📚
Indexes play a crucial role in improving query performance. A missing or poorly designed index can lead to full table scans, causing timeouts.
Example:
CREATE INDEX IX_Orders_CustomerID ON Orders (CustomerID);
Avoid over-indexing. Too many indexes can slow down write operations (like INSERT or UPDATE).
B. Query Refactoring ✍️
Sometimes, the query logic itself needs improvement. Common causes of slow queries:
*Using SELECT : Instead of selecting all columns, explicitly mention only the columns you need.
SELECT CustomerName, OrderDate FROM Orders WHERE OrderID = 100;
Subqueries vs Joins: Subqueries can sometimes slow down performance. Consider using JOINs instead.
C. Statistics Update 📈
Outdated statistics can cause SQL Server to make poor decisions when choosing an execution plan. Ensure that your statistics are up to date:
UPDATE STATISTICS table_name WITH FULLSCAN;
Enable Auto Update Statistics by running:
ALTER DATABASE database_name SET AUTO_UPDATE_STATISTICS ON;
4. Checking for Blocking and Deadlocks 🚧
Blocking occurs when one query is holding a lock and preventing another query from accessing the resource. This can lead to command timeouts if the blocked query takes too long to release the lock.
A. Use sp_who2 🔗
Run the sp_who2 command to see what processes are blocking each other:
EXEC sp_who2;
B. Extended Events for Deadlocks 🔄
Set up Extended Events to track deadlocks and blocking queries.
Deadlock Graph can help visualize what processes are deadlocked and why they’re causing timeouts.
 0:04:40
 1:37:51
 0:05:57
 0:11:03
 0:08:22
 0:34:44
 0:08:31
 4:03:27
 0:15:20
 0:47:26
 0:04:45
 0:43:18
 0:49:23
 0:54:30
 0:03:18
 0:09:25
 0:01:21
 1:03:44
 0:00:00
 1:26:30
 0:00:06
 0:06:31
 1:09:25
 0:36:33