filmov
tv
Statistics: Ch 7 Sample Variability (2 of 14) Two Useful Distributions of a Sample

Показать описание
To donate:
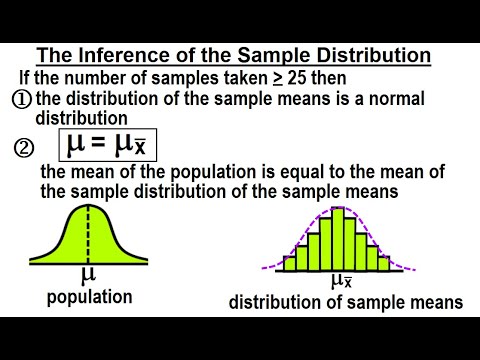
We will learn the sample size (n) must be large enough to represent a population:
1) when many samples (each size n) are taken “the (sample) distribution of the sample means” tends to be a normal distribution,
2) when many samples (each size n) are taken “the (sample distribution of the sample ranges” tends to be skewed to the right.
Previous video in this series can be seen at:
Next video in this series can be seen at:
 0:02:58
Statistics: Ch 7 Sample Variability (1 of 14) Why Do We Sample the Population?
 0:04:14
Statistics: Ch 7 Sample Variability (2 of 14) Two Useful Distributions of a Sample
 0:05:48
Statistics: Ch 7 Sample Variability (9 of 14) Calculate Mean & Standard Deviation of the Populat...
 0:04:28
Statistics: Ch 7 Sample Variability (7 of 14) Distribution of the Sample Means
 0:03:10
Statistics: Ch 7 Sample Variability (3 of 14) The Inference of the Sample Distribution
 0:03:29
Statistics: Ch 7 Sample Variability (4 of 14) The Shape of the Distribution of Sample Means
 0:05:09
Statistics: Ch 7 Sample Variability (10 of 14) Calculate the Mean and Standard Deviation of the Mean
 0:05:19
Statistics: Ch 7 Sample Variability (8 of 14) Distribution of the Sample Ranges
 0:06:59
Statistics: Ch 7 Sample Variability (12 of 14) Sampling Distribution: Ex. 1
 0:04:24
Statistics: Ch 7 Sample Variability (6 of 14) What is the Central Limit Theorem (CLT)?
 0:03:29
Statistics: Ch 7 Sample Variability (5 of 14) The Standard Deviation Depends on Sample Size
 0:04:37
Statistics: Ch 7 Sample Variability (14 of 14) Sampling Distribution: Ex. 3
 0:08:08
Statistics: Ch 7 Sample Variability (13 of 14) Sampling Distribution: Ex. 2
 0:04:19
Statistics: Ch 7 Sample Variability (11 of 14) What is 'The Standard Error of the Mean'?
 0:04:43
Sampling Variability
 0:14:12
AP Statistics Chapter 7 Sampling Distribution Review Problems
 0:11:06
Sampling Distributions (7.2)
 0:03:15
Variability (Statistics)
 0:14:22
STATS Chapter 7 Review
 0:10:21
Standard Deviation Formula, Statistics, Variance, Sample and Population Mean
 0:05:19
AP Stats Chapter 7.1 Day 1
 0:28:27
Chapter 7 AP Statistics Review
 0:03:36
Statistics and Sampling Variability Video
 0:06:46
Rapid Learning: Statistics - What is Central Tendency & Variability?
Комментарии