filmov
tv
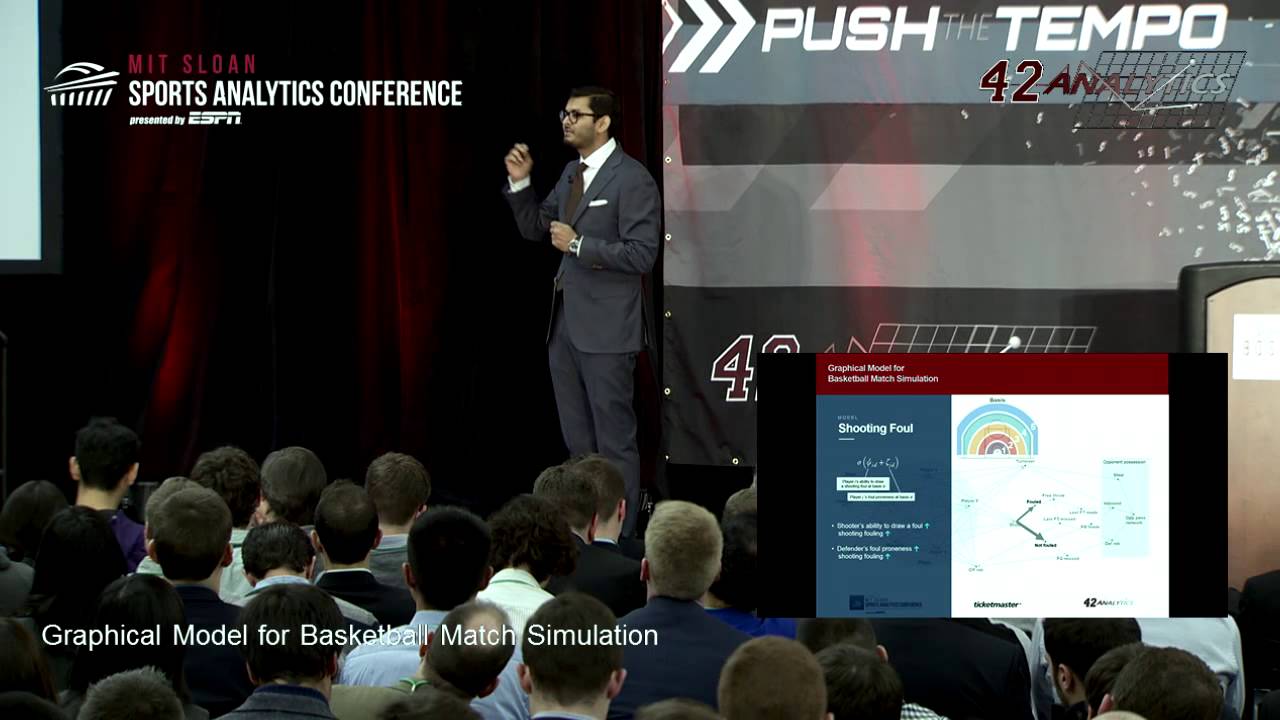
SSAC15: Graphical Model for Basketball Match Simulation
Показать описание
Research Paper presentation from the 9th MIT Sloan Sports Analytics Conference, Friday February 27, 2015, Boston, MA
Conventional approaches to simulate matches have ignored that in basketball the dynamics of ball movement is very sensitive to the lineups on the court and unique identities of players on both offense and defense sides. In this paper, the researchers propose the simulation infrastructure that can bridge the gap between player identity and team level network. They model the progression of a basketball match using a probabilistic graphical model. They model every touch and event in a game as a sequence of transitions between discrete states. They treat the progression of a match as a graph, where each node is a network structure of players on the court, their actions, events, etc., and edges denote possible moves in the game flow. Their results show that either changes in the team lineup or changes in the opponent team lineup significantly affect the dynamics of a match progression. Evaluation on the match data for the 2013-14 NBA season suggests that the graphical model approach is appropriate for modeling a basketball match.
Conventional approaches to simulate matches have ignored that in basketball the dynamics of ball movement is very sensitive to the lineups on the court and unique identities of players on both offense and defense sides. In this paper, the researchers propose the simulation infrastructure that can bridge the gap between player identity and team level network. They model the progression of a basketball match using a probabilistic graphical model. They model every touch and event in a game as a sequence of transitions between discrete states. They treat the progression of a match as a graph, where each node is a network structure of players on the court, their actions, events, etc., and edges denote possible moves in the game flow. Their results show that either changes in the team lineup or changes in the opponent team lineup significantly affect the dynamics of a match progression. Evaluation on the match data for the 2013-14 NBA season suggests that the graphical model approach is appropriate for modeling a basketball match.
 0:27:11
SSAC15: Graphical Model for Basketball Match Simulation
 0:26:51
SSAC15: Counterpoints: Advanced Defensive Metrics for NBA Basketball
 1:00:18
SSAC15: Beat the Odds: Anatomy of an Upset
 0:07:21
Basketball Analytics - BTMA 431
 0:25:50
SSAC15: Diamonds on the Line: Profits through Investment Gaming
 0:00:55
Example of fully automated game filming in action
 0:58:39
SSAC15: Sports Science: Performance Analytics (Presented by Catapult)
 0:00:30
basketball game simulation in Phnom Penh Cambodia
 0:04:10
The price of anarchy in basketball
 1:02:00
SSAC15: Wearable Technology: Athlete Analytics (Presented by Zebra Technologies)
 0:02:36
Global Sports Analytics' EDGE
 0:05:06
NBA Simulator 2015 - Using Algorithms Based on Real Statistics
 0:05:14
Metis Career Day - NBA Prediction Model - Andreas Oikonomou
 0:00:13
Antigravity interface simulation
 0:56:44
SSAC15: NFL's Next Generation Statistics (Sponsored by Zebra Technologies)
 0:59:03
SSAC15: The Formula to Win: College Football Analytics
 1:00:01
SSAC15: Research Paper Finals & Live Judging (Presented by Ticketmaster)
 0:18:50
How SportVU is revolutionizing the NBA
 0:26:50
SSAC15: CA - Keep Your Players on the Ice: Applying Catapult Data
 0:00:25
Event Detection in Commercial Rugby Footage
 0:23:39
SSAC18: High Resolution Shot Capture and An Improved Method for Shooter Evaluation
 0:22:31
SSAC15: Assessing the Offensive Productivity of NHL Players Using In-Game Win Probability
 0:57:50
SSAC15: Technology Amplifies Success: How Analytics Is Changing the Game (Sponsored by SAP)
 0:02:08
Basketball Evaluation Dec 14 2014
Комментарии