filmov
tv
ANOVA Explained With Example (Analysis of Variance)

Показать описание
ANOVA tests are used to check if results from experiments are significant or not or in other words, whether the null hypothesis can be rejected or not. ANOVA is an extension of the t-test because instead of checking the significance of results between 2 datasets, it does it between 3 or more datasets.
To calculate ANOVA you need 2 things:
1. Sum of Squares Within groups (SSW) and its degree of freedom.
2. Sum of Squares Between groups (SSB) and its degree of freedom.
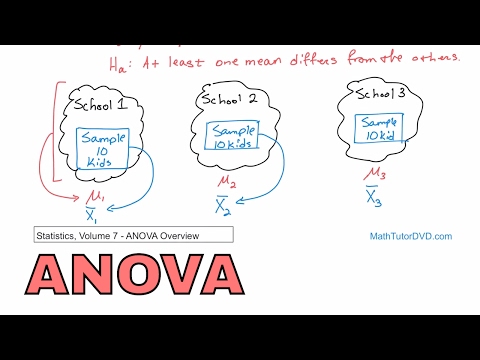
Let’s imagine that we want to compare how many cups of coffee people drink per day in Finland, India and the USA. Is the difference between the groups significant or not? In an attempt to test this, let’s say that we’ve gather data from 5 people from each of these countries.
The participants from Finland answered that they drink 3, 6, 5, 2 and 7 cups of coffee each day. The participants from India answered that they drink 2, 1, 0, 2, and 4 cups of coffee each day. The participants from the USA answered that they drink 3, 5, 1, 2 and 3 cups of coffee each day.
The sum of squares within groups can be calculated in 4 steps:
1. Calculating the mean for each group, which is 4.6 for Finland, 1.8 for India and 2.8 for the USA.
2. Then we square the difference from the mean for each observation.
3. These differences from the mean are then added together, which is 17.2 for Finland and 8.8 for both India and the USA.
4. Finally these sums are added together, which equals 34.8
The sum of squares between groups can be calculated in 3 steps:
1. Calculate the total mean, i.e. the mean of all the samples, which is 3.07.
2. Then, subtract the mean for all of the samples from the mean of each group and square the result.
3. Finally, add all the squared means together and multiply it by the number of observations in each group, in this case 5, to get the final result of 20.13.
Now we can calculate the F-ratio in 3 steps:
1. Divide the sum of squares between groups by its degrees of freedom, which is the number of groups minus 1, or in this case 3-1 = 2. So this gives us 20.13 / 2 = 10.07.
2. Divide the sum of squares within groups by its degrees of freedom, which is the total number of observations minus the number of groups, or in this case 15-3 = 12. So this gives us 34.8 / 12 = 2.9.
3. Now the F-ratio is simply the ratio between these two numbers, so 10.07 / 2.9 = 3.47. So F(2,12) = 3.47.
To check whether or not this result allows us to reject the null hypothesis, we check a F-Distribution table. The critical value for F(2,12) is 3.89. If our F-ratio is larger than the critical value, the null hypothesis can be rejected. So in our case, the difference between the three different sample groups were actually NOT statistically significant as the F-ratio is less than the critical value.
To calculate ANOVA you need 2 things:
1. Sum of Squares Within groups (SSW) and its degree of freedom.
2. Sum of Squares Between groups (SSB) and its degree of freedom.
Let’s imagine that we want to compare how many cups of coffee people drink per day in Finland, India and the USA. Is the difference between the groups significant or not? In an attempt to test this, let’s say that we’ve gather data from 5 people from each of these countries.
The participants from Finland answered that they drink 3, 6, 5, 2 and 7 cups of coffee each day. The participants from India answered that they drink 2, 1, 0, 2, and 4 cups of coffee each day. The participants from the USA answered that they drink 3, 5, 1, 2 and 3 cups of coffee each day.
The sum of squares within groups can be calculated in 4 steps:
1. Calculating the mean for each group, which is 4.6 for Finland, 1.8 for India and 2.8 for the USA.
2. Then we square the difference from the mean for each observation.
3. These differences from the mean are then added together, which is 17.2 for Finland and 8.8 for both India and the USA.
4. Finally these sums are added together, which equals 34.8
The sum of squares between groups can be calculated in 3 steps:
1. Calculate the total mean, i.e. the mean of all the samples, which is 3.07.
2. Then, subtract the mean for all of the samples from the mean of each group and square the result.
3. Finally, add all the squared means together and multiply it by the number of observations in each group, in this case 5, to get the final result of 20.13.
Now we can calculate the F-ratio in 3 steps:
1. Divide the sum of squares between groups by its degrees of freedom, which is the number of groups minus 1, or in this case 3-1 = 2. So this gives us 20.13 / 2 = 10.07.
2. Divide the sum of squares within groups by its degrees of freedom, which is the total number of observations minus the number of groups, or in this case 15-3 = 12. So this gives us 34.8 / 12 = 2.9.
3. Now the F-ratio is simply the ratio between these two numbers, so 10.07 / 2.9 = 3.47. So F(2,12) = 3.47.
To check whether or not this result allows us to reject the null hypothesis, we check a F-Distribution table. The critical value for F(2,12) is 3.89. If our F-ratio is larger than the critical value, the null hypothesis can be rejected. So in our case, the difference between the three different sample groups were actually NOT statistically significant as the F-ratio is less than the critical value.
 0:08:56
ANOVA (Analysis of variance) simply explained
 0:30:04
ANOVA (Analysis of Variance) Analysis – FULLY EXPLAINED!!!
 0:03:53
ANOVA Explained With Example (Analysis of Variance)
 0:14:14
One-Way ANOVA [Analysis of Variance] simply explained
 0:13:29
What is ANOVA (Analysis of Variance) in Statistics ? | Explained with Examples (ANOVA F - test)
 0:08:39
What Is Anova? | Introduction To Analysis And Variance | Anova Explained | Simplilearn
 0:13:17
ANOVA: Crash Course Statistics #33
 0:56:49
ANOVA - A Full Lecture to learn Analysis of Variance
 0:05:02
T test and ANOVA Explained
 0:22:00
12 - Analysis of Variance (ANOVA) Overview in Statistics - Learn ANOVA and How it Works.
 0:13:31
ANOVA: One-way analysis of variance
 0:04:11
What is Analysis of Variance ANOVA & Why Explained with Example
 0:00:38
Anova f statistic ? #anova #statistics #onewayanova #statisticsclass
 0:11:51
Explaining the ANOVA and F-test
 0:15:07
T-test, ANOVA and Chi Squared test made easy.
 0:06:51
One-Way ANOVA
 0:14:30
How To Calculate and Understand Analysis of Variance (ANOVA) F Test.
 0:10:50
One-Way ANOVA
 0:00:16
ANOVA in statistics
 0:08:23
5. ANOVA Clearly Explained | Feature Selection using ANOVA | ANOVA by hand |
 0:09:50
Statistics: ANOVA (Analysis of Variance)
 0:08:31
How To Perform A One-Way ANOVA Test In Excel
 0:01:00
How to perform ANOVA in MS Excel #statistics #shorts #viral
 0:00:16
Hypothesis Testing with ANOVA
Комментарии