filmov
tv
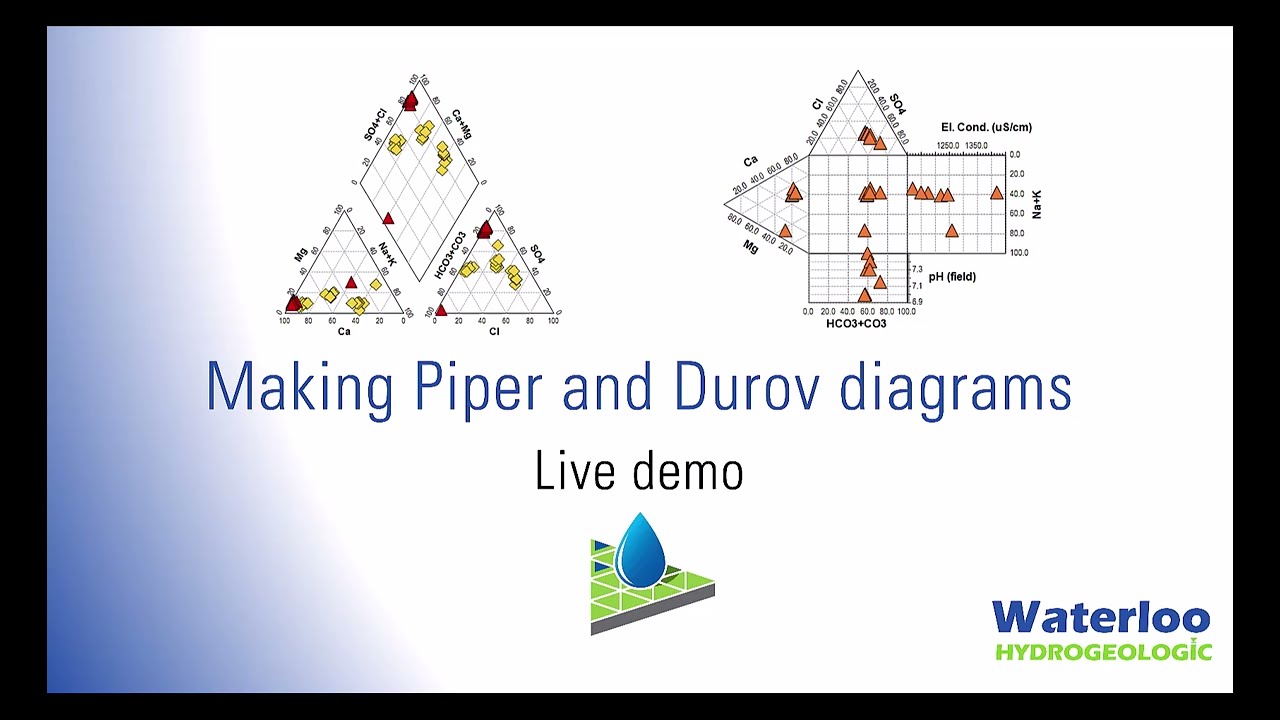
Waterloo Hydrogeologic - How to create Piper diagrams and Durov plots in AquaChem
Показать описание
Did you know Piper diagrams and Durov plots are a powerful way to analyze water sample data? This video shows how to make them in AquaChem with only a few button presses.
AquaChem is our Water Quality Data Analysis and Reporting Software that covers a wide range of functions and calculations including unit transformations, charge balances, and statistics. These powerful analytical capabilities are complemented by an extensive selection of commonly used geochemical plots to represent the chemical characteristics of water quality data.
AquaChem is our Water Quality Data Analysis and Reporting Software that covers a wide range of functions and calculations including unit transformations, charge balances, and statistics. These powerful analytical capabilities are complemented by an extensive selection of commonly used geochemical plots to represent the chemical characteristics of water quality data.
 0:09:09
 0:01:53
 0:10:03
 0:04:08
 0:00:46
 0:00:47
 0:04:36
 0:08:07
 0:12:41
 0:07:18
 0:11:42
 0:07:07
 0:12:50
 0:11:36
 0:01:21
 0:15:06
 0:01:21
 0:11:03
 0:02:02
 0:20:11
 0:07:56
 0:11:15
 0:03:28
 0:42:04