filmov
tv
Best Node js Profiler | Doctor Graph | Clinic Js | how to profile node js

Показать описание
***********Udemy Course*************
Udemy A-Z Node js Course ( Game Development, Desktop App, API, Automation Testing and lot more)
****************************************
how to profile node js?
-----------------------------------------------------------------------------------------------
0.00 Introduction
0.43 Features of Doctor Graph
1.25 Create Profile Graph
6.30 Explanation of Graph
15.44 Example
------------------------------------------------------------------------------------------------
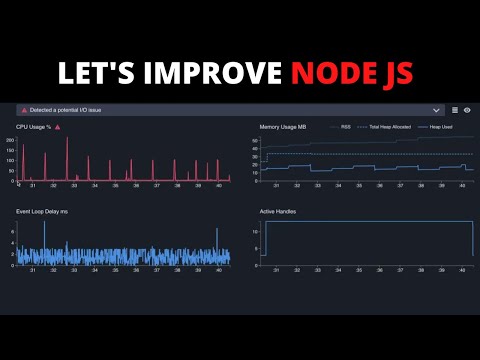
Doctor helps diagnose performance issues in your application and guides you towards more specialised tools to look deeper into your specific issues. Symptoms such as low CPU usage, blocking garbage collection, frequent event loop delay or a chaotic number of active handles may indicate a number of potential problems. Doctor helps narrow down the possibilities by generating a recommendation based on those symptoms. Examples such as I/O issues, non-optimized garbage collection and blocked event loop are quite common. Doctor will help you with all of these.
Once the problem is diagnosed, Doctor helps you find the right solution. It may point you to a specific profiling tool or suggest a common approach to the problem. For those who prefer more context, Doctor also provides an in-depth explanation of the issue. In situations where you have a hunch that the issue may be different than the recommendation, Doctor provides easy access to the documentation of all the other issues.
Комментарии
 0:19:38
 0:08:38
 0:16:06
 0:01:10
 0:08:18
 0:05:48
 0:10:10
 0:17:08
 0:31:05
 0:01:48
 0:08:33
 1:01:53
 0:00:45
 0:26:41
 0:25:22
 0:30:48
 0:07:09
 0:03:42
 1:11:43
 0:17:51
 0:01:26
 0:06:21
 0:15:43
 0:30:02