filmov
tv
How to use the Excel Maps Function: Excel Maps Tutorial

Показать описание
3D Maps in Excel is a data-visualization tool available in Excel 2016 and 2019. Excel 2013 users can also use 3D Maps, but it is available as an add-in called Power Maps. If you are using Excel 2013, you will need to jump into Options, then Add-Ins, and enable Power Maps.
Three-dimensional Maps helps you visualize data in a different way and discover insights you might not see in traditional two-dimensional tables and charts.
3D Maps analyze geographical data. For example, if you are trying to analyze and compare the population of countries around the world. Or maybe analyze crime stats for different towns or states.
With 3D maps, you can plot geographic and temporal data on a globe or custom map. You can show the data changing over time, build engaging, cinematic visual tours and importantly, any map you create can be shared with other people.
Check out our Excel 2021 tutorials for beginners playlist here
Check out our FREE 300+ hour training course playlist here ➡️
💻Watch more popular tutorials from Simon Sez IT:
✅Microsoft Excel 2019 Beginners playlist:
✅Microsoft Excel 2019 Advanced playlist:
💬Stay in touch!
🔔Subscribe to our channel:
If you enjoyed the video, please give a "thumbs up" and subscribe to the channel 👍🏽 ;-)
 0:16:17
Excel Tutorial for Beginners
 0:54:55
Excel for Beginners - The Complete Course
 0:20:28
Excel Tutorial for Beginners [Made Easy]
 0:01:01
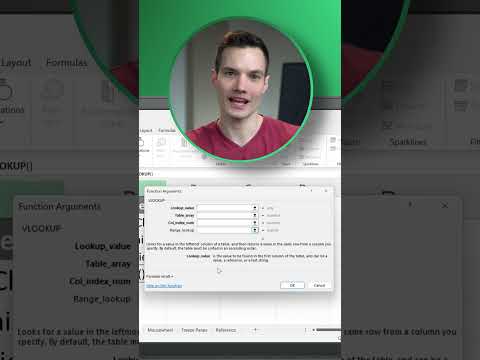
How to use VLOOKUP in Excel
 0:12:29
Excel Formulas and Functions Tutorial
 0:07:08
Microsoft Excel for dummies - learn the basics of Excel
 0:09:56
How To Use Excel
 0:00:16
Excel Hacks | Excel Tutoring Excel Formula for Job Interview Excel for Fresher Excel for Beginners
 0:00:15
And formula in Excel #youtubeshorts #shortsfeed #shorts #shortvideo
 0:05:43
VLOOKUP in Excel | Step-by-Step Tutorial for Beginners
 0:02:38
How to use VLOOKUP in Microsoft Excel
 0:09:46
What is Excel and How to use it?
 0:11:54
How to create a spreadsheet in excel in 5 minutes | excel for beginners
 0:00:10
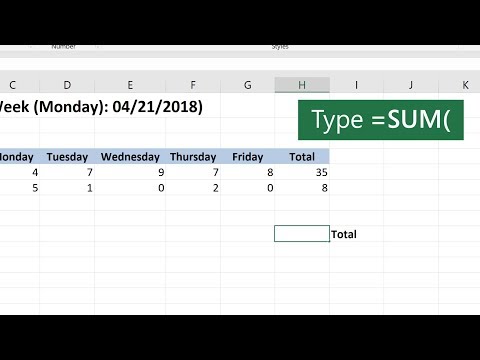
SUM Formula in Excel | Add Total Values #shorts #excel
 0:00:38
How to use the SUM function in Microsoft Excel
 0:32:49
Microsoft Excel Tutorial - Beginners Level 1
 0:00:54
5 Tricks to Become an Excel Wizard
 0:00:37
Excel for fresher Excel tutoring Excel for beginners Job interview questions
 0:00:56
How to Use SUMIF Function in Excel
 0:00:30
Excel Tips You NEVER Knew!
 0:00:41
XLOOKUP function in #excel better than VLOOKUP
 0:01:01
How to use AI features in Excel | Save 4 Hours Daily by using AI Tools #excel #ai #exceltips
 0:00:14
How to use VLOOKUP in Excel! #excel
 0:00:54
How to use the XLOOKUP function in Microsoft Excel
Комментарии