filmov
tv
What is the Best Chart Type?
Показать описание
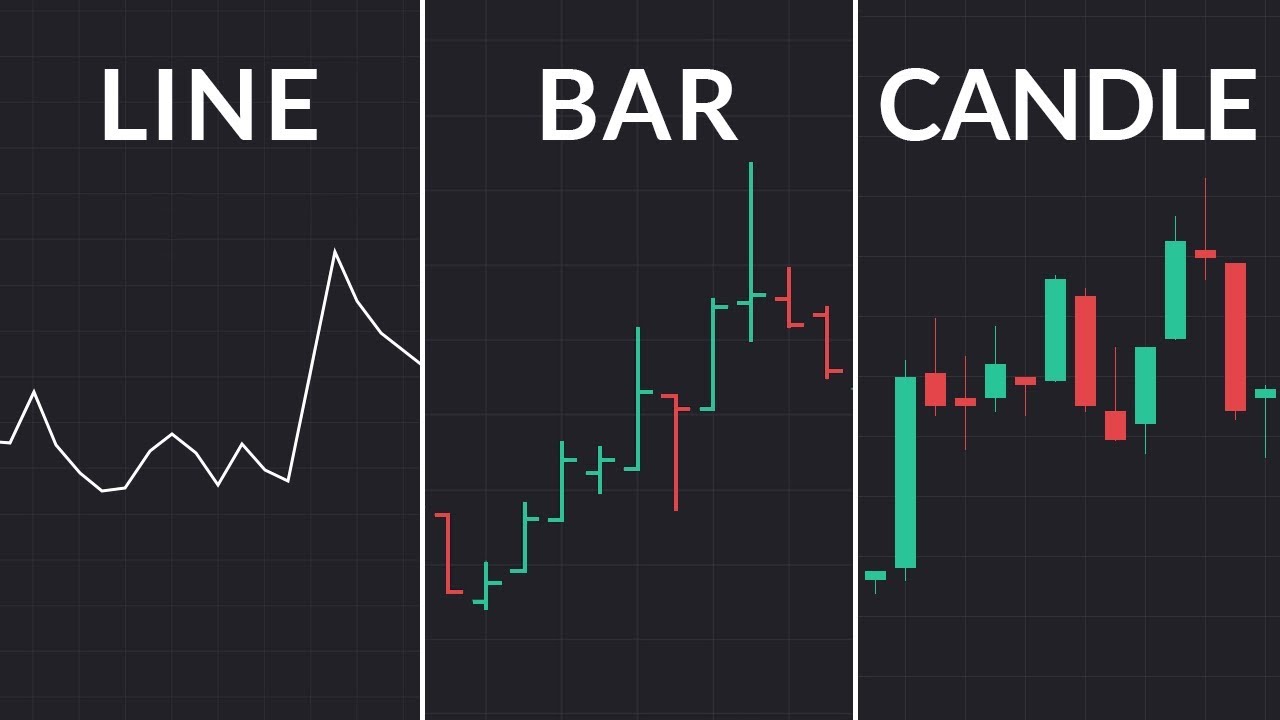
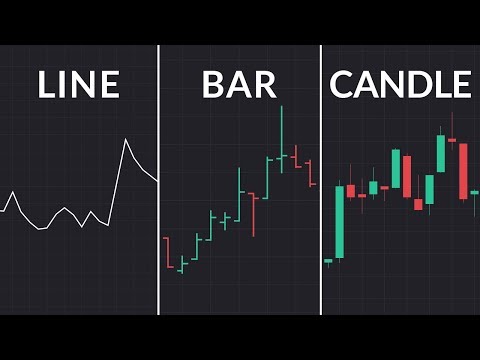
There are three dominant chart types when it comes to trading - line, bar and Japanese candlestick. Of course there are other types but these are used by the vast majority of traders and this is why our trading expert David Jones decided to explain them in a bit more detail.
The first and oftentimes default chart type is the line chart. Simply put it consists of a line that is formed by connecting the closing price levels for every day, hour, minute (or other selected timeframe) forming a continuous line. What price level is displayed can be changed to show the opening price, the high or the low for the day, but the default one (and widely accepted) is the closing price.
As line charts can only show one component of the price movement many traders use the bar chart, as it consists of four data points – the Open price, the Close price, the High and the Low for the time period. This chart type was widely used up until the mid-nineties and is still preferred by many.
But it is the Japanese candlestick that is considered by most to be the superior chart type. It’s essentially an upgrade on the bar chart, as it has the same four components in it but its visual representation (reminiscent of a candlestick with two wicks on both of its ends) is easier to see by the human eye and makes the process of interpreting it a bit quicker.
David also discusses the pros and cons of the three most popular chart types. You’ll be able to understand their importance for setting Stop Loss and Take Profit orders, as well as what you can discover by zooming in and out on charts.
Download our free mobile apps for iOS or Android:
------------------------------------------------------------------------
📲 Trading 212 on Social Media:
------------------------------------------------------------------------
#Investing #Trading #Equities #trading212
The information contained within the video was correct at the time of recording but may have since changed.
At Trading 212 we provide an execution only service. This video should not be construed as investment advice. Investments can fall and rise. Capital at risk. CFDs are complex instruments and come with a high risk of losing money rapidly due to leverage. 81% of retail investor accounts lose money when trading CFDs with this provider. You should consider whether you understand how CFDs work and whether you can afford to take the high risk of losing your money.
 0:12:08
Which is the best chart: Selecting among 14 types of charts Part I
 0:09:02
What is the Best Chart Type?
 0:15:16
The Easiest Charting Video You'll Ever Watch!! | Learn How To Chart In 10 Minutes!
 0:08:10
Which is the best chart: Selecting among 14 types of charts Part II
 0:10:51
The Best Chart Patterns To Trade (Reliability Study)
 0:03:17
Impress Your Boss with this Excel Actual v Target Chart Technique - Quick and Easy!
 0:10:12
Watch Brad Goh Analyze a Chart UNDER 5 mins !
 0:38:15
Ultimate Chart Patterns Trading Course (EXPERT INSTANTLY)
 0:10:11
Nvidia $NVDA Stock Earnings Preview | How To Prepare & Best Chart Levels To Watch
 0:04:49
Popular Chart Time Frames
 0:10:04
Charts for Beginners | How to read and setup a chart | Options for Beginners
 0:08:38
10 Best Chart Patterns explained in under 10 minutes
 0:09:09
The BEST Guide to CHART PATTERNS Price Action
 0:22:03
Chart Patterns + Best Indicators Trading Setup by Kunal Saraogi | Share Market
 0:08:47
15 minute Chart Setups To Day Trade!
 0:10:48
How To Chart Stocks For Beginners In 10 Minutes
 1:10:23
Excel Data Visualization Course – Guide to Charts & Dashboards
 0:02:36
Create a Dynamic Budget vs. Actuals Chart in Excel
 0:08:53
How to Create an Organizational Chart Linked to Data in Excel (Easy & Dynamic)
 0:10:42
15 Year Old Forex Trader Reads Chart Like a Pro & Reveals His 'Golden Zone' Trading Sy...
 0:15:59
How to Make the BEST Gantt Chart in Excel (looks like Microsoft Project!)
 0:06:42
How to Read & Understand a Forex Chart! (For Beginner Forex Traders)
 0:33:55
The EASIEST Charting Strategy - Learn How To Chart Like A PRO ($SPY $SPX) #daytrading
 0:00:25
How to Automatically Find Chart Patterns
Комментарии