filmov
tv
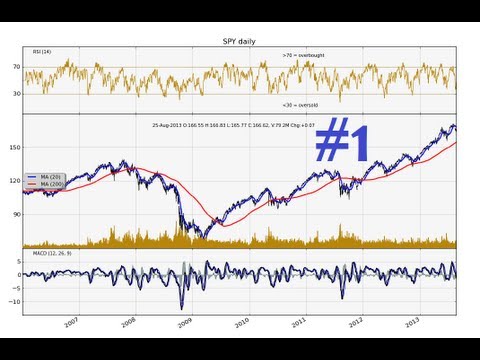
Python Charting Stocks/Forex for Technical Analysis Part 1 - Intro and stock price source

Показать описание
This is the first video in the series for stock price analysis. The purpose of the videos in this series is to teach you how to program your own charting and analysis of stocks or Forex.
This is beneficial for you if you plan to do any sort of algorithmic, high-frequency, or any sort of automated trading.
 0:08:14
Python Charting Stocks/Forex for Technical Analysis Part 1 - Intro and stock price source
 0:05:42
Python Charting Stocks/Forex for Technical Analysis Part 6 - Basic Financial Graph
 0:16:06
Python Charting Stocks/Forex for Technical Analysis Part 7 - Basic Financial Graph
 0:13:05
Python Charting Stocks/Forex for Technical Analysis Part 2 - How to get free Stock Prices
 0:29:47
Technical Stock Analysis Made Easy in Python
 0:07:10
Python Charting Stocks/Forex for Technical Analysis Part 3 - Free intra-day stock data
 0:15:29
Python Charting Stocks/Forex for Technical Analysis Part 10 - Price and Volume Chart Matplotlib
 0:15:07
Python Charting Stocks/Forex for Technical Analysis Part 4 - Automating stock prices
 0:08:01
Python Charting Stocks/Forex for Technical Analysis Part 9 - Adding Volume data to matplotlib graph
 0:08:07
Python Charting Stocks/Forex for Technical Analysis Part 8 - Improving our Stock Chart
 0:09:37
Charting Stocks/Forex for Technical Analysis Part 27 - Adding texts and Annotations to Matplotlib
 1:17:35
The Only Technical Analysis Video You Will Ever Need... (Full Course: Beginner To Advanced)
 0:21:03
Python Charting Stocks/Forex for Technical Analysis Part 5 - Finishing price puller
 0:08:12
ChatGPT Trading Strategy Made 19527% Profit ( FULL TUTORIAL )
 0:10:31
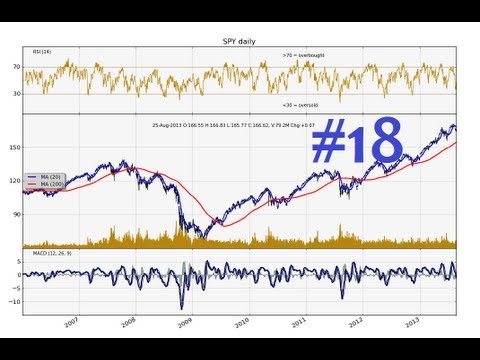
Charting Stocks and Forex in python Part 18 - How to calculate RSI in python
 0:12:46
Charting Stocks and Forex in python Part 17 - Overlay a stock's volume in matplotlib
 0:05:57
Tradingview Technical Indicators Integrated in Python [Intro]
 0:07:31
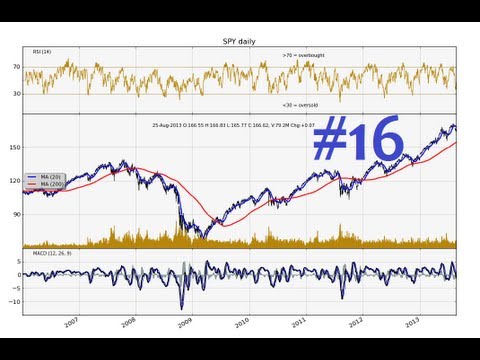
Charting Stocks/Forex for Technical Analysis Part 16 - How to add SMA to matplotlib stock chart
 0:18:46
How To Build A Trading Bot In Python
 0:00:16
Beginner Traders On Their First Day Be Like #shorts
 0:06:03
Charting Stocks and Forex in python Part 19 - How to add RSI to matplotlib graph
 0:07:10
Charting Stocks and Forex Part 22 - How to calculate MACD in python
 0:10:11
Charting Stocks/Forex for Technical Analysis Part 11 - Candlestick and Volume Chart in Matplotlib
 0:00:12
Turning $100 to $ 1,00,000 Day Forex trading market || Auto trading Bot
Комментарии