filmov
tv
Trading With Bollinger Bands; SchoolOfTrade.com

Показать описание
In today's video we are going to take a look at Bollinger Bands. They are a VERY popular indicator that several traders use to get in and out of positions all day and can give you some very solid patterns to trade off of!
Learn the trading strategy for FREE here:
---------------------------------------------
Become a Member and Join the Trade Room:
-----------------------------------------
Join our Trade Room on a FREE PASS:
-----------------------------------------
Contact the office for more information:
800.381.2084
Skype: Megan.James12345
----------------------------------------------
Economic News:
Please remember that economic news, both scheduled and un-scheduled will increase volatility and decrease liquidity in the market in the short-term, which causes price-action to react inconsistently with the levels of support and resistance mentioned in this video. Trading during economic news reports is dangerous and highly discouraged, no matter what your level of experience.
PLEASE DO NOT TRADE DURING TIMES OF MAJOR ECONOMIC NEWS
----------------------------------------------
----------------------------------------------
U.S. Government Required Disclaimer - Commodity Futures Trading Commission
Futures and Options trading have large potential rewards, but also large potential risk. You must be aware of the risks and be willing to accept them in order to invest in the futures and options markets. Don't trade with money you can't afford to lose. This is neither a solicitation nor an offer to Buy/Sell futures or options. No representation is being made that any account will or is likely to achieve profits or losses similar to those discussed on this web site. The past performance of any trading system or methodology is not necessarily indicative of future results.
----------------------------------------------
*CFTC RULE 4.41 – These results are based on simulated or hypothetical performance results that have certain inherent limitations. Unlike the results shown in an actual performance record, these results do not represent actual trading. Also, because these trades have not actually been executed, these results may have under-or-over-compensated for the impact, if any, of certain market factors, such as liquidity. Simulated or hypothetical trading programs in general are also subject to the fact that they are designed with the benefit of hindsight. No representation is being made that any account will or is likely to achieve profits or losses similar to these being shown.
 0:04:11
Trading With Bollinger Bands; SchoolOfTrade.com
 0:09:40
Bollinger Bands: Beginner Guide
 0:01:48
John Bollinger: How to Use Bollinger Bands Profitably
 0:03:20
Tradehacking.com Trade School - Bollinger Bands
 0:04:31
Bollinger Bands® and %b
 0:04:41
Trading Like a Trader - Ask JAPA RICO About Bollinger Bands - Secrets Finally Revealed
 0:10:22
Bollinger Bands - Learn To Use Them The Right Way
 0:01:21
Bollinger bands - HelpForex4u
 0:06:01
Making Profit with Price Action and Bollinger Bands in the Forex Market!
 0:38:18
ETF Trading with Bollinger Bands
 0:04:24
Bollinger Band Squeeze Swing Trading Ep #19
 0:41:03
Applying Bollinger Bands to Your Trading Strategy
 0:02:00
What is Forex Bolly Band Bounce Strategy?
 0:02:33
Making Money with Bollinger Bands
 0:10:06
Bollinger Bands: What They Are & How To USE Them 🔰
 0:41:28
Bollinger Bands Masterclass with Barry Norman
 0:04:06
Double Bollinger Bands - Rule3&Rule4 ✫Forex Trading
 0:32:06
How to trade with Bollinger Bands by TradeSmart
 0:13:39
RICH JAP: BOLLINGER BANDS: WHY THEY WORK AND WHY THEY DON'T - RICH JAP
 0:01:48
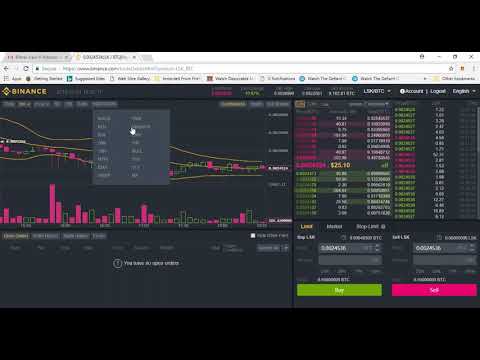
How to apply Bollinger Bands to Binance
 0:06:30
Bollinger Bands Trading Strategy
 0:10:35
Financial Trading: The Power of Bollinger Bands
 0:01:10
Squeeze Reversal Forex Bollinger Band Strategy - How To Trade Using Forex Strategies
 0:11:29
RSI + Bollinger Band Trading Strategy
Комментарии