filmov
tv
Calculate Moving (or Rolling) Average In Excel | Add Rolling Average Chart

Показать описание
In this video I demonstrate how to perform moving (or rolling) average calculations. Typically rolling average calculations are performed over a seven day period, you might however perform the calculations over five or thirty days.
Table of Contents:
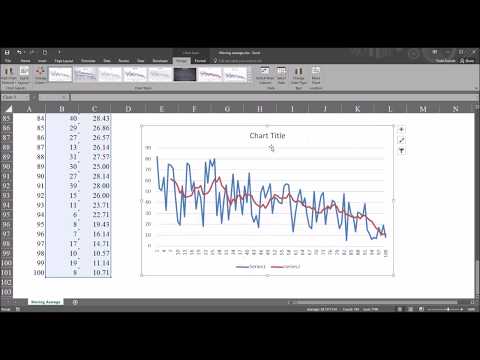
00:00 - Using formula to calculate moving averages and adding a chart to graphically display moving averages
02:12 - Using the Analysis ToolPak to perform the calculations and produce a chart
------------------------
 0:04:25
Calculate Moving (or Rolling) Average In Excel | Add Rolling Average Chart
 0:04:38
Calculate a Moving Average in Microsoft Excel (Rolling Average, Rolling Mean, Moving Mean)
 0:09:22
SQL Query | How to calculate rolling / moving average ? | Ex - 3 day rolling average
 0:09:35
Moving Average (Rolling Average) in Pandas and Python - Set Window Size, Change Center of Data
 0:09:28
Moving (Rolling) Average in Excel 2016
 0:03:04
Moving Average In Excel 2021 | How To Calculate Moving Average In Excel | Moving Average
 0:05:41
Moving Average in Excel (Seven-Day Rolling Average)
 0:03:26
How to calculate moving / rolling average Excel
 0:04:21
What is a moving average? Calculating a simple moving average
 0:16:05
How to Calculate Moving Averages in Power BI - The Ultimate Guide
 0:07:05
Excel Magic Trick 1406: Calculate Moving Average with AVEARGEIFS & EOMONTH Functions
 0:04:59
How to Calculate a Rolling Average in Excel
 0:16:43
Computing rolling average in DAX
 0:03:07
KPI: Monthly vs 12 Month Moving Average Revenue
 0:06:02
How to Calculate a Moving/Rolling Average in SQL
 0:01:00
How to Calculate Rolling Average in Excel
 0:02:34
SQL: Calculate 7 Day Moving Average
 0:05:34
Calculate Dynamic Rolling Average in PowerBI using a Slider | MiTutorials
 0:11:00
Calculate a Rolling Average in Power BI Using DAX
 0:04:42
Stock Trading: Moving Averages
 0:13:21
Calculate MOVING AVERAGES using DATESINPERIOD DAX Function // DAX Basics Guide in Power BI
 0:01:00
Excel Pro Trick: Calculate Moving Average in Excel: Rolling Average with Variable Interval in Excel
 0:03:56
Moving Average Calculation in Excel
 0:03:08
Moving Averages - Forecasting Methods
Комментарии