filmov
tv
Arduino-Based Environmental Monitoring System: Real-Time Data Visualization with Node-RED & MATLAB

Показать описание
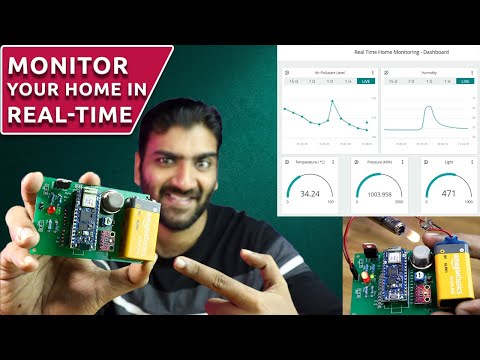
In this video, I demonstrate the functionality of my Arduino-based Environmental Monitoring System, which integrates multiple sensors to monitor environmental parameters such as light intensity, temperature, and pressure in real time. The system utilizes an Arduino Uno R4 with LDR, TMP36, and MPX5700AP sensors, which send data to a Node-RED dashboard for live visualization.
Key Highlights:
Arduino IDE: Learn how the Arduino code reads data from the sensors and sends it to Node-RED via serial communication.
Node-RED Setup: See how Node-RED processes the incoming sensor data and displays it on an interactive dashboard with real-time gauges and charts.
MATLAB Integration: Watch how MATLAB was used to simulate and visualize sensor data, allowing for data analysis and validation before real-time monitoring.
System Demonstration: Watch the system in action as it monitors changes in light intensity, temperature, and pressure, with live updates on the Node-RED dashboard.
In this demonstration:
I walk you through how the system works, from the sensor readings in the Arduino IDE to the real-time data visualization on the Node-RED dashboard.
The MATLAB graphs show how pressure and temperature behave over time, helping ensure sensor accuracy.
You will see how the system responds to changes in the environment, such as adjusting light intensity or temperature, and how the data is updated in real time.
This project showcases the power of combining Arduino, MATLAB, and Node-RED to build an efficient and interactive environmental monitoring system.
Software Used:
Arduino IDE for programming the microcontroller.
Node-RED for real-time data processing and visualization.
MATLAB for data analysis and graphing.
If you have any questions or would like to learn more about how this system was built, feel free to leave a comment below!
 0:10:30
 0:08:57
 0:07:29
 0:18:42
 0:00:24
 0:07:54
 0:00:08
 0:08:55
 0:00:22
 0:02:06
 0:00:51
 0:14:21
 0:00:19
 0:04:48
 0:10:06
 0:00:13
 0:00:21
 0:00:40
 0:06:34
 0:05:34
 0:00:16
 0:02:13
 0:07:25
 0:16:15