filmov
tv
Distillation: Phase equilbria

Показать описание
0:00 Gibbs phase rule (Not Biggs!)
2:02 Boiling point and vapour pressure
2:49 Antoines equation
3:00 Raoult's law and Dalton's law
4:47 Exercise: Draw P-x,y diagram at constant T
5:53 Solution to exercise
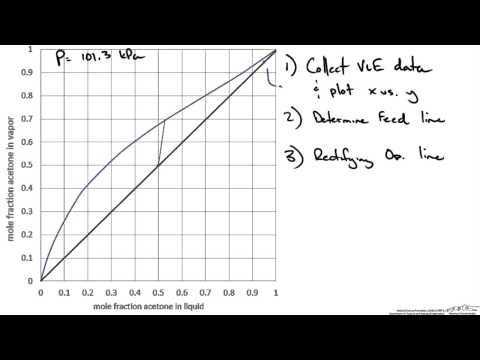
6:50 Constant P and x-y diagram
7:29 Non-ideal mixtures: Activity coefficients
8:26 Henry's law
9:06 Why non-ideal?
9:43 Azeotrop
10:24 Distillation vs Azeotrop
10:34 Summary
Describes how P-x,y diagrams (constant T) can be created for ideal solutions using Raoults law and Daltons law.
Continues with x-y-diagrams,
non-ideal mixtures,
Henry’s law and activity coefficients,
why some mixtures are not ideal and
what an azeotrope is
Links to distillation screencasts
Intro:
Continuous destillation (McCabe-Thiele):
Wider context:
Special:
2:02 Boiling point and vapour pressure
2:49 Antoines equation
3:00 Raoult's law and Dalton's law
4:47 Exercise: Draw P-x,y diagram at constant T
5:53 Solution to exercise
6:50 Constant P and x-y diagram
7:29 Non-ideal mixtures: Activity coefficients
8:26 Henry's law
9:06 Why non-ideal?
9:43 Azeotrop
10:24 Distillation vs Azeotrop
10:34 Summary
Describes how P-x,y diagrams (constant T) can be created for ideal solutions using Raoults law and Daltons law.
Continues with x-y-diagrams,
non-ideal mixtures,
Henry’s law and activity coefficients,
why some mixtures are not ideal and
what an azeotrope is
Links to distillation screencasts
Intro:
Continuous destillation (McCabe-Thiele):
Wider context:
Special:
 0:03:51
Distillation and phase equilibria
 0:11:24
Distillation: Phase equilbria
 0:20:39
D1-Distillation and phase equilibria
 0:10:58
Distillation
 0:00:51
Flash Distillation Phase Diagram
 0:01:06
Vapor/Liquid Equilibrium Ratio Demonstration
 0:03:08
y-x Phase Diagram for VLE of a Binary Mixture
 0:48:08
PHASE EQUILIBRIA (IMMISCIBLE LIQUIDS): STEAM DISTILLATION. LESSON 10.
 0:14:53
Txy and Pxy Diagrams
 0:21:24
PHASE EQUILIBRIA (LESSON 12). STEAM DISTILLATION (GRAPHS)
 0:05:05
IEK213 Vapor-Liquid Equilibrium in Distillation
 0:11:07
Vapour -Liquid Equilibrium and Q-line for Distillation (McCabe-Thiele)
 0:01:11
Simple Batch Distillation Phase Diagram
 0:02:16
Multistage Distillation Column Demonstration
 0:19:52
Vapor Liquid Equilibrium for Engineers
 0:43:28
Lec 32: Vapor Liquid Equilibrium: Part 1
 0:10:07
Binary Phase Diagram (Txy and xy)
 0:07:29
Distillation: Intro & overview
 0:03:35
Making a McCabe Thiele Diagram Excel - Fast
 0:09:34
WHAT IS THE DIFFERENCE BETWEEN DISTILLATION COLUMN TRAYS AND STAGES OF EQUILIBRIUM
 0:22:25
TX-Phase Diagram and Distillation 5381 2019
 0:41:28
Phase Equilibrium | Binary Flash Distillation (Graphical) | Solution Thermo | Ask Teacher Jay
 0:08:22
McCabe-Thiele Graphical Method Example Part 1
 0:05:37
Q-line on a y-x Phase Diagram
Комментарии