filmov
tv
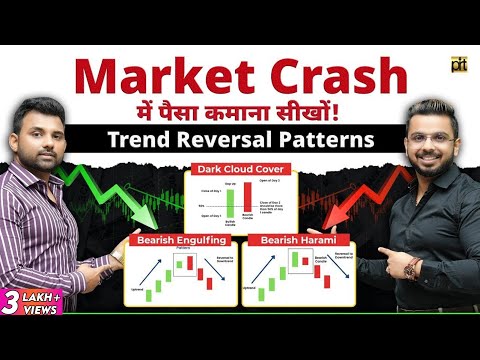
Trend Reversal Patterns

Показать описание
How to spot a trend reversal using different market patterns & indicators.
***LINKS***
For charts Use Trading View
💲Brokers I use:
👩💻Hugosway-
👩💻KOT4X-
Trading Platform
META TRADER 4
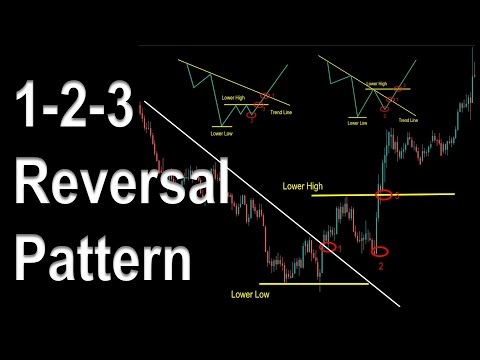
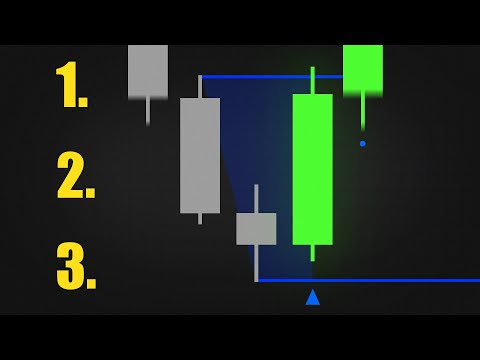
Capturing trending movements in a stock or other type of asset can be lucrative. However, getting caught in a reversal is what most traders who pursue trending stock fear. A reversal is anytime the trend direction of a stock or other type of asset changes. Being able to spot the potential of a reversal signals to a trader that they should consider exiting their trade when conditions no longer look favorable. Reversal signals can also be used to trigger new trades, since the reversal may cause a new trend to start.
Trend Reversal Confirmation
Regardless of whether a 10-minute bar or weekly bars were used, the trend reversal trading system worked well in the tests, at least over the test period, which included both a substantial uptrend and downtrend.
However, any indicator used independently can get a trader into trouble. One pillar of technical analysis is the importance of confirmation. A trading technique is far more reliable when there is a secondary indicator used to confirm signals.
Given the risk in trying to pick a top or bottom of the market, it is essential that at a minimum, the trader uses a trendline break to confirm a signal and always employs a stop loss in case they are wrong. In our tests, the relative strength index (RSI) also gave good confirmation at many of the reversal points in the way of negative divergence.
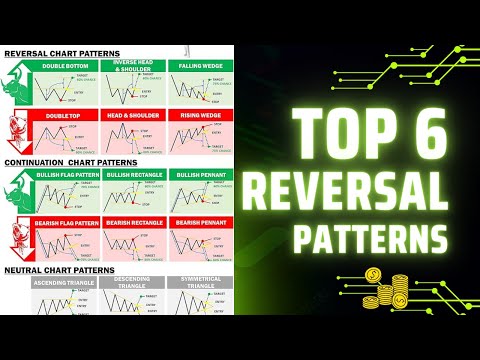
Reversals are caused by moves to new highs or lows. Therefore, these patterns will continue to play out in the market going forward. An investor can watch for these types of patterns, along with confirmation from other indicators, on current price charts.
***NOT FINANCIAL ADVICE DISCLAIMER***
The information contained here and the resources available for download through this website is not intended as, and shall not be understood or construed as, financial advice. I am not an attorney, accountant or financial advisor, nor am I holding myself out to be, and the information contained on this Website is not a substitute for financial advice from a professional who is aware of the facts and circumstances of your individual situation.
We have done our best to ensure that the information provided here and the resources available for download are accurate and provide valuable information. Regardless of anything to the contrary, nothing available on or through this Website should be understood as a recommendation that you should not consult with a financial professional to address your particular information. The Company expressly recommends that you seek advice from a professional.
*None of this is meant to be construed as investment advice, it's for entertainment purposes only. Links above include affiliate commission or referrals. I'm part of an affiliate network and I receive compensation from partnering websites. The video is accurate as of the posting date but may not be accurate in the future.
***LINKS***
For charts Use Trading View
💲Brokers I use:
👩💻Hugosway-
👩💻KOT4X-
Trading Platform
META TRADER 4
Capturing trending movements in a stock or other type of asset can be lucrative. However, getting caught in a reversal is what most traders who pursue trending stock fear. A reversal is anytime the trend direction of a stock or other type of asset changes. Being able to spot the potential of a reversal signals to a trader that they should consider exiting their trade when conditions no longer look favorable. Reversal signals can also be used to trigger new trades, since the reversal may cause a new trend to start.
Trend Reversal Confirmation
Regardless of whether a 10-minute bar or weekly bars were used, the trend reversal trading system worked well in the tests, at least over the test period, which included both a substantial uptrend and downtrend.
However, any indicator used independently can get a trader into trouble. One pillar of technical analysis is the importance of confirmation. A trading technique is far more reliable when there is a secondary indicator used to confirm signals.
Given the risk in trying to pick a top or bottom of the market, it is essential that at a minimum, the trader uses a trendline break to confirm a signal and always employs a stop loss in case they are wrong. In our tests, the relative strength index (RSI) also gave good confirmation at many of the reversal points in the way of negative divergence.
Reversals are caused by moves to new highs or lows. Therefore, these patterns will continue to play out in the market going forward. An investor can watch for these types of patterns, along with confirmation from other indicators, on current price charts.
***NOT FINANCIAL ADVICE DISCLAIMER***
The information contained here and the resources available for download through this website is not intended as, and shall not be understood or construed as, financial advice. I am not an attorney, accountant or financial advisor, nor am I holding myself out to be, and the information contained on this Website is not a substitute for financial advice from a professional who is aware of the facts and circumstances of your individual situation.
We have done our best to ensure that the information provided here and the resources available for download are accurate and provide valuable information. Regardless of anything to the contrary, nothing available on or through this Website should be understood as a recommendation that you should not consult with a financial professional to address your particular information. The Company expressly recommends that you seek advice from a professional.
*None of this is meant to be construed as investment advice, it's for entertainment purposes only. Links above include affiliate commission or referrals. I'm part of an affiliate network and I receive compensation from partnering websites. The video is accurate as of the posting date but may not be accurate in the future.
 0:01:00
How To Predict Reversals
 0:11:03
The ONLY 3 Reversal Patterns You Will Ever Need...
 0:00:54
1-2-3 Reversal Trading Strategy | 95% Winrate Reversal Pattern
 0:11:45
The ONLY Candlestick Pattern Guide You'll EVER NEED
 0:04:44
Trend Reversal Trading Strategy
 0:00:35
My Favorite Reversal Trading Pattern...
 0:12:57
The ONLY 3 Reversal Patterns You Will Ever Need...
 0:05:02
Most Accurate Reversal Pattern Indicator (3 Bar Reversal)
 0:00:19
Piercing Line vs. Dark Cloud Cover | Powerful Candlestick Reversal Patterns | Bullish & Bearish
 0:00:47
The Common MISTAKE Traders Make With Doji Candles #Shorts
 0:09:11
Best Reversal Chart Patterns Strategies That Work Every Time
 0:18:03
3 Signs That Tell You Exactly When The Trend Is OVER...(Reversal Trading Strategy)
 0:00:49
Simplest Trend Reversal Entry Model
 0:09:18
How To Tell When A Trend Will Reverse (Must Watch)
 0:22:33
Trend Reversal Candlestick Patterns | Learn Share Market Basics | Stock Market Crash Trading
 0:08:57
6 Reversal Candlestick Patterns You Need To Know Before Starting Trading
 0:00:07
Reversal chart patterns
 0:20:54
Trend Reversal Patterns
 0:00:37
Amazing Reversal Pattern Indicator
 0:09:57
This Oscillator Shows Up To 99% Trend Reversal Probabilities!
 0:00:59
My Trend Line Strategy:
 0:00:06
trend reversal pattern | market reversal candlestick patterns #analysis #tips #bignner #nifty
 0:00:37
Best Reversal Candlestick Patterns
 0:00:06
Top 6 Reversal Chart Patterns #candle #stockmarket #trading #candlestick #reversalpatterns
Комментарии