filmov
tv
(SDB6) Service Desk part2 Monitoring tools, Help desk tools, BMC Helix ITSM Demo(Practical)
Показать описание
20221105 121631
00:00 Monitoring tools, Help desk tools
46:00 BMC Helix ITSM Demo(Practical)
Monitoring: -understand function of our infrastructure , application , services
System/Device Status -On/ Off
Resources Monitoring of devices - CPU, RAM, DISK, Network
Performance of devices - CPU, RAM, DISK, Network,
Application Performance - App utilizing - cpu,ram, disk, nw
Process Monitoring
Networking Monitoring - Device Status On/Off , Wake on LAN, Network connectivity, IP Address, Nw Load, Traffic, Protocols and PortNo
*SNMP - protocol used for monitoring
Tools:
Nagios XI
Zabbix
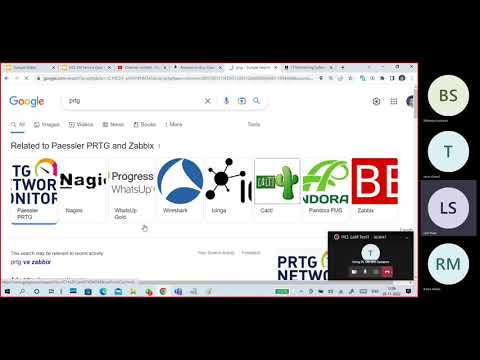
PRTG
New Relic
WhatsUp Gold ,Splunk
WireShark
Splunk
Solarwinds Network Performance Monitor (NPM)
Zabbix is a mature and effortless enterprise-class open source monitoring solution for network monitoring and application monitoring of millions of metrics
PRTG - Paessler Router Traffic Grapher (PRTG) Network Monitor is network management software for bandwidth, usage, and availability monitoring. This technology runs on a Windows machine within the network and can automatically discover devices and collect various statistics
WhatsUp Gold Log Management provides easy visibility and management of device log data – all integrated into an easy-to-use, industry-leading interface. You can monitor, filter, search and alert on syslogs or Windows logs for every device in your network while also watching for meta trends like log volume changes.
SolarWinds® Network Performance Monitor (NPM) is a powerful and affordable network monitoring software enabling you to quickly detect, diagnose, and resolve network performance problems and outages.
Splunk is used for monitoring and searching through big data. It indexes and correlates information in a container that makes it searchable, and makes it possible to generate alerts, reports and visualizations
New Relic is a Software as a Service offering that focuses on performance and availability monitoring. It uses a standardized Apdex (application performance index) score to set and rate application performance across the environment in a unified manner.
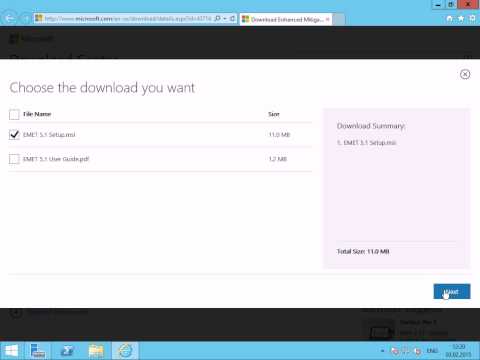
Download Nagios xi
Installing Nagios XI
—-
Service Desk or Help Desk - Tools/Software:
ServiceNow
ZOHO
JIRA
OSTicket
GLPI
Freshservice
Zendesk
T = Ticket
All Service Desk events start with a ticket. A ticket is an historical document that details a service event, such as an incident, problem, or service request. Tickets govern and control how a service event is processed. They are used to route events between different resources for resolution. They record all relevant information about a request, including:
User notes
Technician notes
Workflow information for how the ticket was handled
Ticket resolution
Other critical processing information
Tickets can document a single incident or service request. They can also group together, control, and document several incidents as a single problem. The ticket is the backbone of your Service Desk. It is used for every single service item that hits the Service Desk.
00:00 Monitoring tools, Help desk tools
46:00 BMC Helix ITSM Demo(Practical)
Monitoring: -understand function of our infrastructure , application , services
System/Device Status -On/ Off
Resources Monitoring of devices - CPU, RAM, DISK, Network
Performance of devices - CPU, RAM, DISK, Network,
Application Performance - App utilizing - cpu,ram, disk, nw
Process Monitoring
Networking Monitoring - Device Status On/Off , Wake on LAN, Network connectivity, IP Address, Nw Load, Traffic, Protocols and PortNo
*SNMP - protocol used for monitoring
Tools:
Nagios XI
Zabbix
PRTG
New Relic
WhatsUp Gold ,Splunk
WireShark
Splunk
Solarwinds Network Performance Monitor (NPM)
Zabbix is a mature and effortless enterprise-class open source monitoring solution for network monitoring and application monitoring of millions of metrics
PRTG - Paessler Router Traffic Grapher (PRTG) Network Monitor is network management software for bandwidth, usage, and availability monitoring. This technology runs on a Windows machine within the network and can automatically discover devices and collect various statistics
WhatsUp Gold Log Management provides easy visibility and management of device log data – all integrated into an easy-to-use, industry-leading interface. You can monitor, filter, search and alert on syslogs or Windows logs for every device in your network while also watching for meta trends like log volume changes.
SolarWinds® Network Performance Monitor (NPM) is a powerful and affordable network monitoring software enabling you to quickly detect, diagnose, and resolve network performance problems and outages.
Splunk is used for monitoring and searching through big data. It indexes and correlates information in a container that makes it searchable, and makes it possible to generate alerts, reports and visualizations
New Relic is a Software as a Service offering that focuses on performance and availability monitoring. It uses a standardized Apdex (application performance index) score to set and rate application performance across the environment in a unified manner.
Download Nagios xi
Installing Nagios XI
—-
Service Desk or Help Desk - Tools/Software:
ServiceNow
ZOHO
JIRA
OSTicket
GLPI
Freshservice
Zendesk
T = Ticket
All Service Desk events start with a ticket. A ticket is an historical document that details a service event, such as an incident, problem, or service request. Tickets govern and control how a service event is processed. They are used to route events between different resources for resolution. They record all relevant information about a request, including:
User notes
Technician notes
Workflow information for how the ticket was handled
Ticket resolution
Other critical processing information
Tickets can document a single incident or service request. They can also group together, control, and document several incidents as a single problem. The ticket is the backbone of your Service Desk. It is used for every single service item that hits the Service Desk.
 1:17:23
 1:09:37
 0:00:14
 0:00:28
 2:18:46
 0:00:27
 0:00:16
 0:00:08
 0:00:28
 0:11:32
 0:02:31
 0:02:19
 0:00:08
 0:28:22
 0:00:45
 0:54:53
 0:19:47
 0:10:09
 0:09:10
 0:04:29
 0:15:03
 0:00:45
 0:01:00