filmov
tv
Find population percentages using z-scores and tables

Показать описание
Find population percentages using z-scores and tables
In this lesson you will learn how to find what percentage of a population falls within a certain interval by using z-scores and tables.
ADDITIONAL MATERIALS
STANDARDS
VA.S.AII.11.a identify and describe properties of a normal distribution;
CCSS.HSS-ID.A.4 Use the mean and standard deviation of a data set to fit it to a normal distribution and to estimate population percentages. Recognize that there are data sets for which such a procedure is not appropriate. Use calculators, spreadsheets, and tables to estimate areas under the normal curve.
FL.MAFS.912.S-ID.1.4 Use the mean and standard deviation of a data set to fit it to a normal distribution and to estimate population percentages. Recognize that there are data sets for which such a procedure is not appropriate. Use calculators, spreadsheets, and tables to estimate areas under the normal curve.
IN.PS.DA.2 Compute and use mean, median, mode, weighted mean, geometric mean, harmonic mean, range, quartiles, variance, and standard deviation. Use tables and technology to estimate areas under the normal curve. Fit a data set to a normal distribution and estimate population percentages. Recognize that there are data sets not normally distributed for which such procedures are inappropriate.
TEKS.S.6.E interpret confidence intervals for a population parameter, including confidence intervals from media or statistical reports;
 0:08:07
Find population percentages using z-scores and tables
 0:08:03
Finding % of population using z-scores. - Made Easy
 0:05:21
Normal Distribution: Calculating Probabilities/Areas (z-table)
 0:04:14
Finding z-score for a percentile | AP Statistics | Khan Academy
 0:51:03
Standard Normal Distribution Tables, Z Scores, Probability & Empirical Rule - Stats
 0:06:57
Z-Scores, Standardization, and the Standard Normal Distribution (5.3)
 0:10:55
Z-Scores and Percentiles: Crash Course Statistics #18
 0:08:26
Finding Area/Percentage Between Two Z-Scores
 0:03:45
Z-Test Explained
 0:15:23
Finding Percentiles for a Normal Distribution
 0:10:38
Find Percentile with Mean and Standard Deviation (Normal Curves) | Statistics
 0:07:18
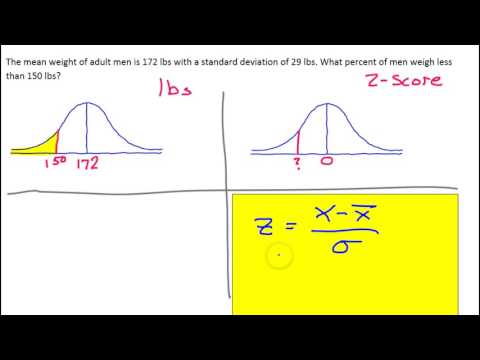
How to Find Z-score, Data value and Population Standard Deviation with one Unknown
 0:04:51
Normal Distribution: Find Probabilities Given Z-scores Using Table (Left of Z-score)
 0:07:26
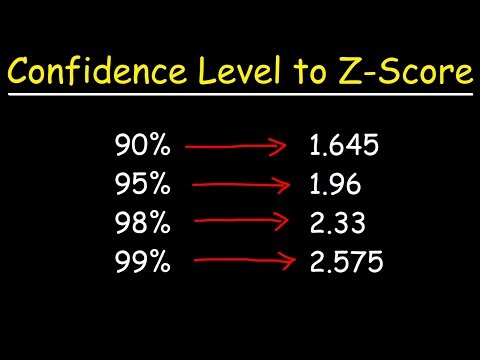
How To Find The Z Score Given The Confidence Level of a Normal Distribution 2
 0:07:09
Finding Areas Under And What Is The Standard Normal Distribution Curve And Z Scores Explained
 0:06:11
5A How do you use Z Scores to find the percentage of data above below a certain value
 0:03:16
What Are And How To Calculate Z Scores - Z Score Statistics Formula Explained
 0:05:37
Normal Distribution: Finding z and x -Inverse Lookup
 0:01:15
Calculate Percent from Z-Score on TI-84
 0:19:07
Intro to Standard Z-Score & Normal Distribution in Statistics
 0:00:41
Z-Score of Sample Mean - Intro to Inferential Statistics
 0:07:10
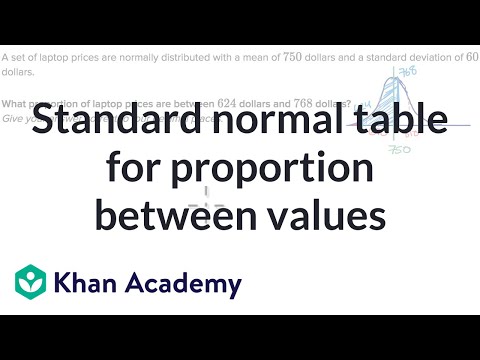
Standard normal table for proportion between values | AP Statistics | Khan Academy
 0:20:35
How To Find The Z Score, Confidence Interval, and Margin of Error for a Population Mean
 0:05:37
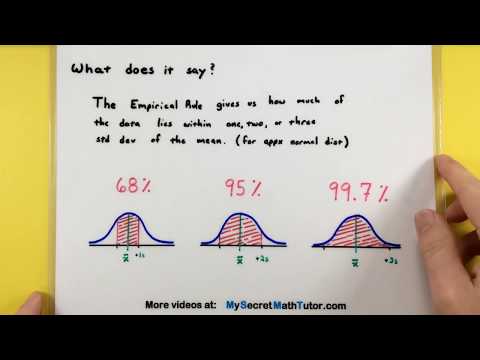
Statistics - How to use the Empirical Rule
Комментарии