filmov
tv
What is a Yield Curve? Recessions Leading Indicator
Показать описание
What is a Yield Curve? Recessions Leading Indicator. Ask The Professor is a finStream TV personal finance short form video series hosted by real life Professor Mike Milligan. In this episode of Ask The Professor, the Professor answers the question: What is a Yield Curve? Recessions Leading Indicator and explains Yield Curves and how understanding them can help you predict when a recession will occur.
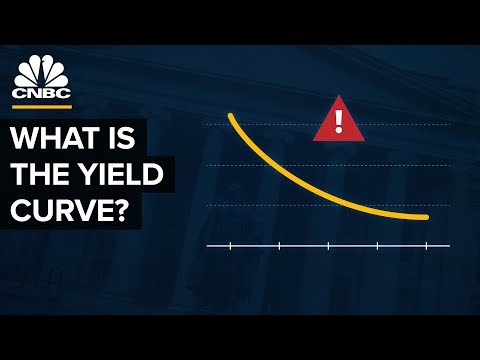
What is a Yield Curve? A yield curve is a graphical representation of the relationship between the yields (interest rates) and the maturity dates of a series of fixed-income securities, such as Treasury bonds or corporate bonds, with similar credit quality but different maturity dates. The yield curve plots the yields on the vertical axis and the time to maturity on the horizontal axis, typically with shorter maturities on the left and longer maturities on the right.
Here are the key points about yield curves:
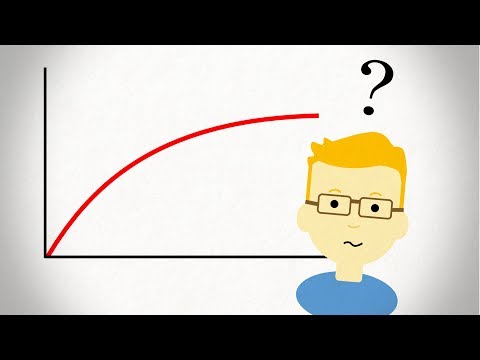
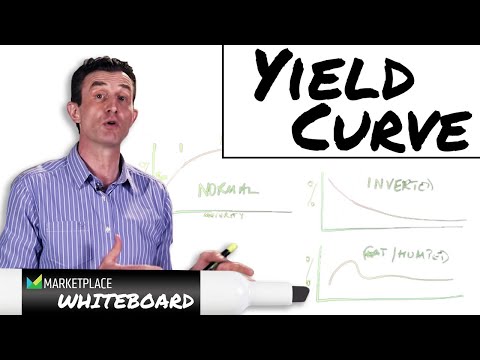
Normal Yield Curve: In a normal yield curve, longer-term bonds have higher yields compared to shorter-term bonds. This upward-sloping yield curve reflects the expectation of higher returns for investors who commit their funds for longer periods, compensating for the additional risk associated with longer maturities, such as inflation risk and interest rate risk.
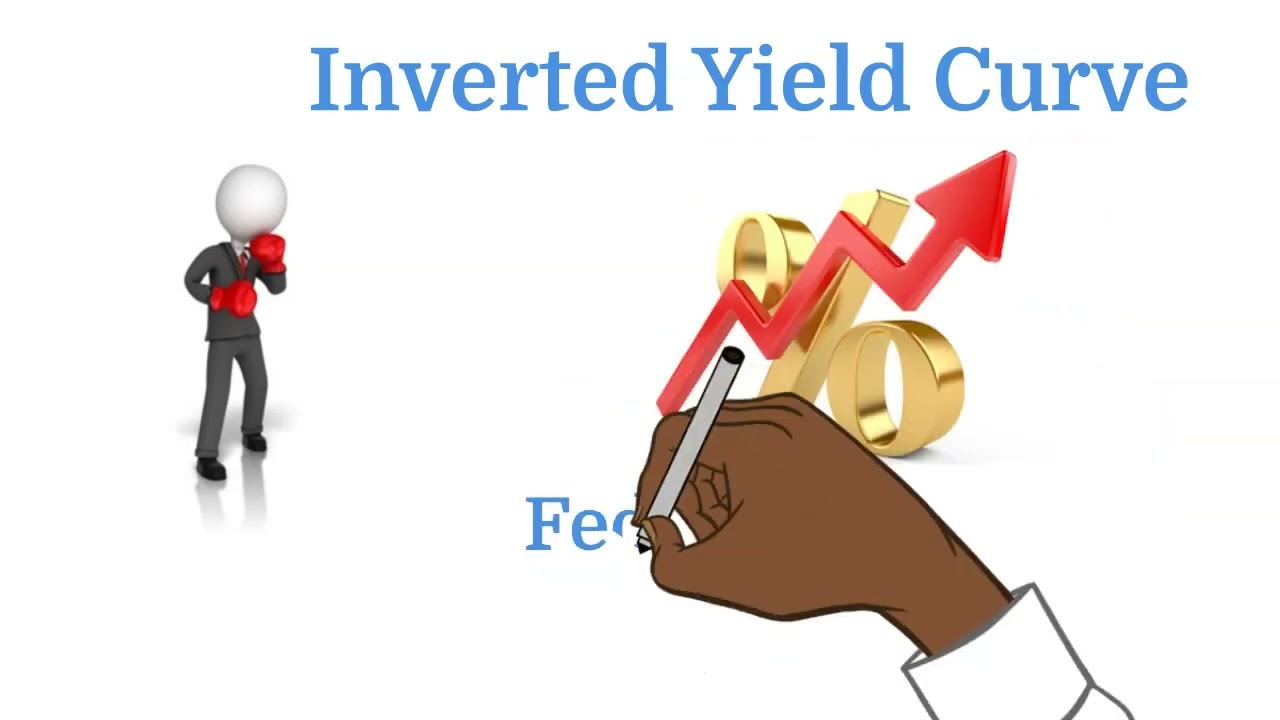
Inverted Yield Curve: An inverted yield curve occurs when shorter-term bonds have higher yields compared to longer-term bonds. This downward-sloping yield curve is considered unusual and often signals expectations of economic slowdown or recession. Inverted yield curves are closely watched by economists and investors as a potential predictor of future economic conditions.
Flat Yield Curve: A flat yield curve occurs when the yields on shorter-term and longer-term bonds are relatively similar. This type of yield curve suggests uncertainty about future economic conditions and interest rate movements. A flat yield curve may occur during transitions between economic cycles or periods of market volatility.
Factors Influencing Yield Curves: Yield curves are influenced by various factors, including:
Monetary policy set by central banks, such as the Federal Reserve in the United States.
Inflation expectations and inflationary pressures.
Economic growth prospects and market sentiment.
Supply and demand dynamics in the bond market.
Global economic and geopolitical events.
Uses of Yield Curves: Yield curves are widely used by investors, economists, policymakers, and analysts for various purposes, including:
Assessing market expectations for future interest rates and economic conditions.
Analyzing the relative value of different bond maturities and sectors.
Making investment decisions, such as asset allocation and bond selection.
Conducting economic research and forecasting.
Overall, yield curves provide valuable insights into the fixed-income markets and can help market participants make informed decisions about investments, risk management, and economic outlooks. However, it's essential to interpret yield curve movements in the context of broader economic and market conditions and to consider other factors that may influence bond yields and prices.
What is a Yield Curve? A yield curve is a graphical representation of the relationship between the yields (interest rates) and the maturity dates of a series of fixed-income securities, such as Treasury bonds or corporate bonds, with similar credit quality but different maturity dates. The yield curve plots the yields on the vertical axis and the time to maturity on the horizontal axis, typically with shorter maturities on the left and longer maturities on the right.
Here are the key points about yield curves:
Normal Yield Curve: In a normal yield curve, longer-term bonds have higher yields compared to shorter-term bonds. This upward-sloping yield curve reflects the expectation of higher returns for investors who commit their funds for longer periods, compensating for the additional risk associated with longer maturities, such as inflation risk and interest rate risk.
Inverted Yield Curve: An inverted yield curve occurs when shorter-term bonds have higher yields compared to longer-term bonds. This downward-sloping yield curve is considered unusual and often signals expectations of economic slowdown or recession. Inverted yield curves are closely watched by economists and investors as a potential predictor of future economic conditions.
Flat Yield Curve: A flat yield curve occurs when the yields on shorter-term and longer-term bonds are relatively similar. This type of yield curve suggests uncertainty about future economic conditions and interest rate movements. A flat yield curve may occur during transitions between economic cycles or periods of market volatility.
Factors Influencing Yield Curves: Yield curves are influenced by various factors, including:
Monetary policy set by central banks, such as the Federal Reserve in the United States.
Inflation expectations and inflationary pressures.
Economic growth prospects and market sentiment.
Supply and demand dynamics in the bond market.
Global economic and geopolitical events.
Uses of Yield Curves: Yield curves are widely used by investors, economists, policymakers, and analysts for various purposes, including:
Assessing market expectations for future interest rates and economic conditions.
Analyzing the relative value of different bond maturities and sectors.
Making investment decisions, such as asset allocation and bond selection.
Conducting economic research and forecasting.
Overall, yield curves provide valuable insights into the fixed-income markets and can help market participants make informed decisions about investments, risk management, and economic outlooks. However, it's essential to interpret yield curve movements in the context of broader economic and market conditions and to consider other factors that may influence bond yields and prices.
 0:04:40
 0:08:59
 0:04:28
 0:01:29
 0:10:26
 0:14:38
 0:13:15
 0:11:25
 0:03:09
 0:05:17
 0:01:42
 0:05:59
 0:02:36
 0:01:29
 0:01:55
 0:00:54
 0:05:00
 0:04:16
 0:04:19
 0:06:16
 0:04:10
 0:04:38
 0:08:40
 0:09:21