filmov
tv
AP Precalculus Practice Test: Unit 2 FRQ #2 TI-84+, Exponential Regression, Population
Показать описание
My AP Precalculus Practice Tests are carefully designed to help students build confidence for in-class assessments, support their work on AP Classroom assignments, and thoroughly prepare them for the AP Precalculus exam in May.
### AP Precalculus Practice Test: Unit 2 FRQ #2 - TI-84+, Exponential Regression, Population
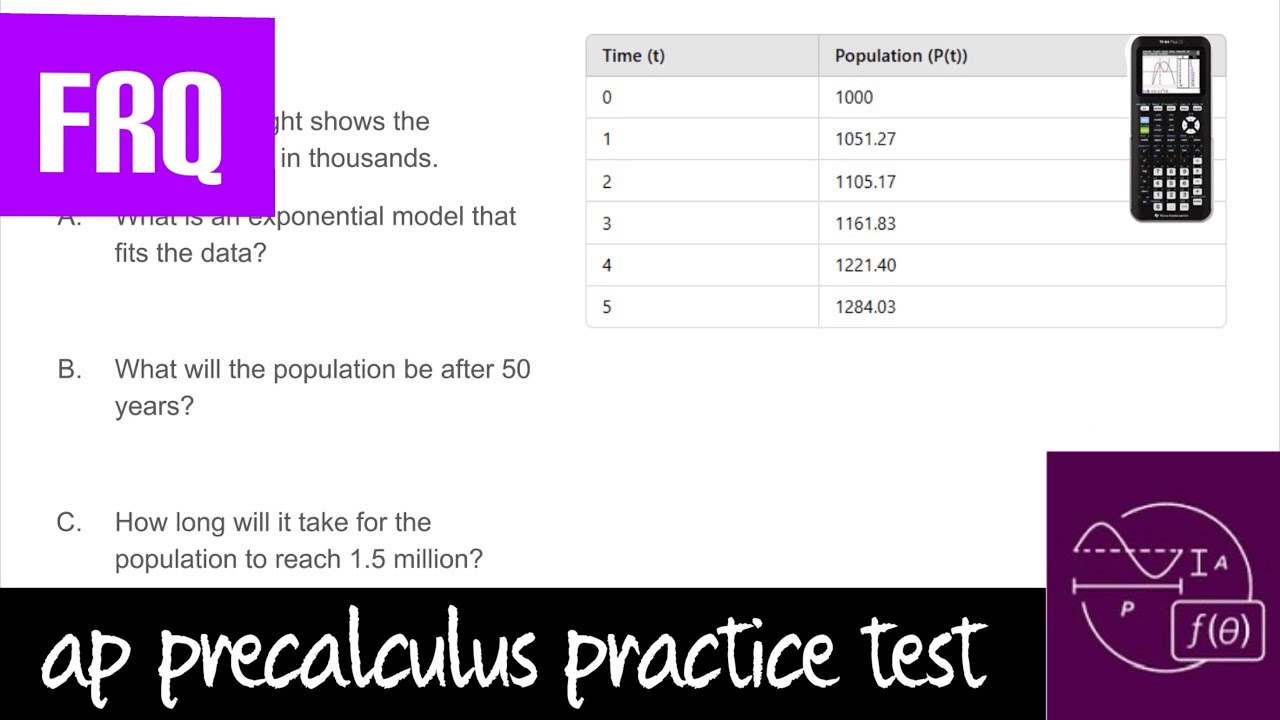
This problem typically involves using a TI-84+ calculator to perform exponential regression on data, typically population data, and then interpreting the results.
---
### Problem Overview:
You're given a table of data (such as population growth over time) and asked to find an exponential regression model using the TI-84+. The exponential model has the form:
\[
y = ab^x
\]
Where:
- \( y \) is the dependent variable (e.g., population),
- \( x \) is the independent variable (e.g., time),
- \( a \) is the initial value (the value of \( y \) when \( x = 0 \)),
- \( b \) is the growth rate.
### Steps to Solve:
1. **Input Data into the TI-84+**:
- Press the **STAT** button.
- Select **1:Edit** to enter your data.
- Input the values of \( x \) (independent variable) in **L1** and the corresponding \( y \) (dependent variable) values in **L2**.
2. **Perform Exponential Regression**:
- After entering the data, press **STAT** again.
- Scroll over to **CALC** and choose **0: ExpReg** (Exponential Regression).
- For **Xlist**, use **L1**, and for **Ylist**, use **L2**.
- Press **Enter** to get the regression results.
3. **Interpret the Results**:
The TI-84+ will display the regression model in the form:
\[
y = a \cdot b^x
\]
Where:
- \( a \) is the initial value (population at \( x = 0 \)),
- \( b \) is the growth factor (rate of change of population).
The calculator will also give you the **correlation coefficient** (denoted \( r \)), which indicates how well the model fits the data. A value of \( r \) close to 1 suggests a strong fit.
4. **Use the Model for Predictions**:
- Once you have the exponential regression equation, you can use it to predict future values by plugging in the appropriate \( x \)-value (time).
---
### Example:
**Given Data**:
| Year (x) | Population (y) |
|----------|----------------|
| 0 | 1000 |
| 1 | 1200 |
| 2 | 1440 |
| 3 | 1728 |
| 4 | 2073.6 |
1. **Enter the Data**:
- Press **STAT**, then **1: Edit**.
- Input the years in **L1** and the populations in **L2**.
2. **Perform Exponential Regression**:
- Press **STAT**, then move to **CALC** and select **0: ExpReg**.
- Choose **L1** for the **Xlist** and **L2** for the **Ylist**, then press **Enter**.
3. **Interpret Results**:
Suppose the calculator gives the following output:
\[
y = 1000 \cdot 1.2^x
\]
- Here, \( a = 1000 \) (the initial population when \( x = 0 \)),
- \( b = 1.2 \) (the growth factor, meaning the population increases by 20% each year).
4. **Prediction**:
To predict the population in year 5, substitute \( x = 5 \) into the model:
\[
y = 1000 \cdot 1.2^5 \approx 2488.32
\]
So, the population in year 5 is approximately **2488**.
---
### Summary:
- Use the TI-84+ to perform exponential regression on the given data.
- The regression model has the form \( y = ab^x \), where \( a \) is the initial population and \( b \) is the growth rate.
- Use the model to predict future values by substituting \( x \) with the desired time value.
I have many informative videos for Pre-Algebra, Algebra 1, Algebra 2, Geometry, Pre-Calculus, and Calculus. Please check it out:
/ nickperich
Nick Perich
Norristown Area High School
Norristown Area School District
Norristown, Pa
#math #algebra #algebra2 #maths #math #shorts #funny #help #onlineclasses #onlinelearning #online #study
 1:12:46
 0:42:35
 0:18:59
 0:57:24
 0:09:45
 1:54:59
 0:20:35
 0:02:26
 2:11:30
 0:01:20
 1:14:14
 0:01:05
 0:27:40
 0:04:02
 0:01:30
 0:02:00
 1:46:11
 3:28:30
 0:08:23
 0:38:27
 0:01:41
 0:01:49
 0:02:01
 0:01:53