filmov
tv
How To Draw Trendlines Step By Step

Показать описание
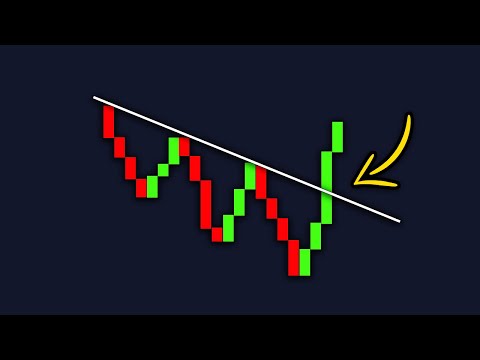
Trendlines are a very powerful tool in technical analysis. You can use trendlines in many ways - for trend trading, breakout and pullbacks.
in this video, I explain everything you need to know about how to trade with trendlines. First, we explore how to draw trendlines and then we learn how to apply them to find better trading setups.
* no investment advice - informational and entertainment purposes only *
Do you like my free YouTube videos? Then you will love the Tradecademy! In the Tradecademy, you find 80 brand-new and never-seen-before trading videos in a completely new trading course. Plus, you join a private discord community, live trading webinars and you can interact with me directly.
New: Tracademy - online trading academy
Our weekly trading newsletter:
Our trading journal:
Trading podcast:
####
Risk Disclaimer:
Any and all liability for risks resulting from investment transactions or other asset dispositions carried out by the customer based on information received or market analysis is expressly excluded by Quantum Trade Solutions GmbH. All the information made available here is generally provided to serve as an example only, without obligation and without specific recommendations for action. It does not constitute and cannot replace investment advice. We, therefore, recommend that you contact your personal financial advisor before carrying out specific transactions and investments.
In view of the high risks, you should only carry out such transactions if you understand the nature of the contracts (and contractual relationships) you are entering into and if you are able to fully assess the extent of your risk potential. Trading with futures, options, forex, CFDs, stocks, cryptocurrencies and similar financial instruments is not suitable for many people. You should carefully consider whether trading is appropriate for you based on your experience, your objectives, your financial situation and other relevant circumstances.
Information and Opinions: Information on this site is provided solely for informational or general educational purposes and should not be construed as an offer to sell or the solicitation of an offer to buy securities or to provide investment advice. The opinions and analyses included herein are based on sources believed to be reliable, but no representation or warranty, express or implied is made as to their accuracy, completeness, timeliness, or correctness. All information contained herein should be verified independently.
Results: Past performance is not necessarily indicative of future results. Investment information may not be appropriate for all investors. HYPOTHETICAL PERFORMANCE RESULTS HAVE MANY INHERENT LIMITATIONS, SOME OF WHICH ARE DESCRIBED BELOW. NO REPRESENTATION IS BEING MADE THAT ANY ACCOUNT WILL OR IS LIKELY TO ACHIEVE PROFITS OR LOSSES SIMILAR TO THOSE SHOWN. IN FACT, THERE ARE FREQUENTLY SHARP DIFFERENCES BETWEEN HYPOTHETICAL PERFORMANCE RESULTS AND THE ACTUAL RESULTS SUBSEQUENTLY ACHIEVED BY ANY PARTICULAR TRADING PROGRAM.
#forex #trading #technicalanalysis
 0:09:25
BEST Trend Lines Strategy for Daytrading Forex & Stocks (Simple Technique)
 0:00:43
How To Draw The Perfect Trend Line #shorts
 0:00:27
How to draw the right trendline
 0:39:20
How to Draw Trend Lines the RIGHT Way on CANDLESTICK Charts
 0:09:21
How To Draw Trendlines Step By Step
 0:05:52
Think or Swim Tutorial : How to Draw Trendlines & Customize Them
 0:12:00
Easy way to draw Trendlines
 0:10:17
How to Draw Trend Lines on TradingView: Tutorial
 0:08:38
Trendline Masterclass: How to Draw Accurate Trendlines | Live Trading Example
 0:52:11
How to draw trend lines - a formal step-by-step guide | tradimo
 0:00:18
How to start trading trendlines in 30 days
 0:18:37
How To Draw Trendlines Like A Pro (My Secret Technique) by Rayner Teo
 0:00:59
Learn how to trade trend lines in 60 seconds ⏰
 0:04:24
Accurate Trend Lines Trading Strategy **ADVANCED**
 0:08:05
The ONLY Trendline Trading Video You'll EVER NEED!
 0:00:14
TRENDline trading #trading #scalping #tradingstrategy #tradinganalysis #banknifty #nifty #nifty50
 0:09:24
How to Draw Trendline Correctly | Trading Strategy | Price Lesson
 0:00:26
How to draw the perfect Trendline #crypto #forex
 0:15:31
Revealing my SECRET Trendline Break Strategy
 0:01:34
Tori.trades trendline strategy (explained)
 0:08:49
Explaining Trends and How to Draw Trendlines
 0:02:46
How To Trade Trendlines Profitably In Under 3 Minutes
 0:01:20
How To Draw Trend Lines
 0:01:00
Master Trendline Trading the Easy Way
Комментарии