filmov
tv
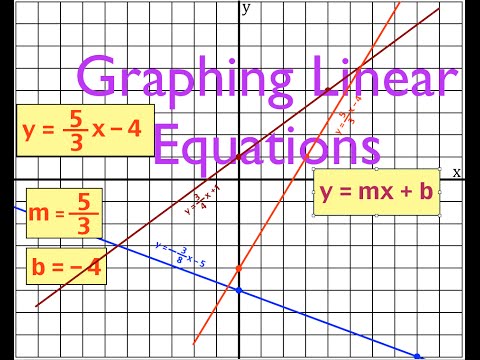
Graphing Linear Equations, No. 1

Показать описание
This video shows you how to graph linear equations that are in the slope intercept form; y = mx + b. We will use the y-intercept and the slope to get the two points needed to graph the line.
 0:09:37
Graphing Linear Equations, No. 1
 0:04:29
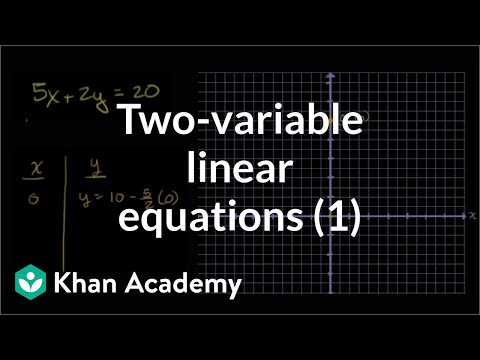
Graphing solutions to two-variable linear equations example 1 | Algebra I | Khan Academy
 0:13:10
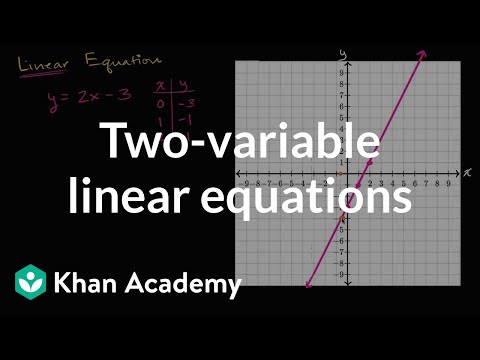
Graphs of linear equations | Linear equations and functions | 8th grade | Khan Academy
 0:32:05
Linear Equations - Algebra
 0:10:52
Solving Systems of Linear Equations By Graphing │Algebra
 0:08:20
Two-variable linear equations and their graphs | Algebra I | Khan Academy
 0:08:10
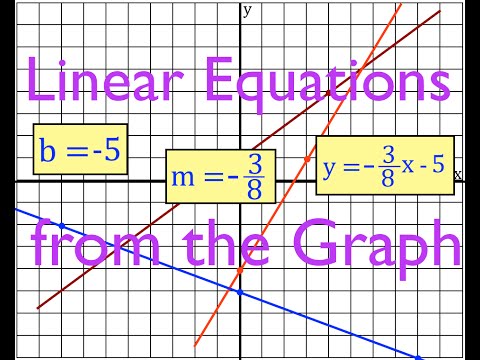
Linear Equations from the Graph of the Line, No. 1
 0:05:22
Solving a linear system of two equations by graphing
 1:38:54
Straight Lines & Quadratics: A Graphing Guide
 0:02:11
Graphing a line given point and slope | Linear equations & graphs | Algebra I | Khan Academy
 0:06:52
Graphing Lines in Algebra: Understanding Slopes and Y-Intercepts
 0:05:15
Solving Systems of Equations By Graphing
 0:10:47
Solving System of Linear Equations by Graphing - Math Teacher Gon
 0:15:01
Linear Functions
 0:10:14
Algebra Basics: Graphing On The Coordinate Plane - Math Antics
 0:03:50
Linear Equations in 2 Variables – Graphs 01
 0:02:29
Graphing linear equations tutorial for 7th and 8th grade students
 0:03:27
Graphing linear equations — Harder example | Math | SAT | Khan Academy
 0:07:05
How To Graph Linear Inequalities In Two Variables - Basic Introduction, Algebra
 0:17:09
Graphing Linear Equations 1 - GED Math
 0:05:25
Graphing Linear Equations
 0:04:53
GCSE Maths - What on Earth is y = mx + c #67
 0:43:20
Linear Equations With Two Variables -- Graphing Lines (TTP Video 28)
 0:10:34
LINEAR INEQUALITIES GRAPHING EXPLAINED!
Комментарии