filmov
tv
VisiData Case Study #2: save data for cities in certain counties as json

Показать описание
Using VisiData v1.1 to select counties from a list of US cities, and saving the resulting data as json suitable for use with Google Maps.
Commands used:
★ 0:50 % to set column type to floating point number
★ 0:55 ! to set a key column (x-axis in the case of a graph)
★ 1:05 . (dot) to plot the current column on the y-axis
★ 1:25 'd' on the canvas deletes the underling rows on the source sheet
★ 1:37 _ (underscore) on the canvas resizes it to fit the whole screen
★ 2:21 gF to get a frequency analysis of two key columns
★ 2:55 / to search in the current column
★ 3:03 'n' to move to the next search match
★ 3:10 's' on the frequency analysis to select source rows
★ 3:47 { and } to move to the prev/next selected row
★ 3:55 " to open a new sheet with only the selected rows
★ 4:07 'gu' to unselect all rows
★ 4:15 - (minus) to hide columns
★ 4:25 # to set column type to integer number
★ 4:32 Ctrl-S to save; extension determines format
 0:05:09
VisiData Case Study #2: save data for cities in certain counties as json
 0:06:14
VisiData case study #7: wrangling hundreds of csv files
 0:06:45
VisiData Case Study #3: graphing calculator
 0:01:08
VisiData: how to merge two tables with the same structure
 0:12:04
Visidata Case Study #5: scrape html table, reshape and tidy
 0:05:53
VisiData Case Study #1: summing donation data from a webpage
 0:00:20
visidata
 0:00:51
Why Saul Pwanson built VisiData as open source software
 0:01:30
Visidata example—plotting COVID-19 variant percentages over time
 0:04:53
VisiData Video #6: Big Melt
 0:04:51
VisiData Lightning Demo at PyCascades 2018
 0:03:26
VisiData melted sheet
 0:01:10
VisiData Hello World scatter plot
 0:04:58
VisiData video #4: directory browser (new features in v1.2)
 0:02:46
VisiData : Natural Sorting
 0:06:48
VisiData demo: accessing webpages and other formats
 0:03:47
VisiData demo 1: find duplicate keys in a single dataset
 0:00:52
Analyzing 0x.Tools xcapture data with VisiData
 0:05:33
q - query csv
 0:05:05
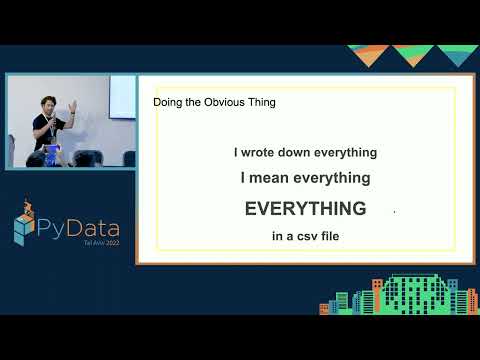
Avishai Barnoy: DeepCook: Code Your Way Through Everyday Chores | PyData Tel Aviv 2022
 0:09:59
VisiData demo: new menu system
 0:02:02
Visidata example—plotting airport runway orientation
 0:48:27
Linux for mainframers tools, tricks, commands - M108
 0:03:18
CLI Plotting
Комментарии