filmov
tv
TAMIL ELASTICSEARCH LOGSTASH KIBANA STACK | ELK Tutorial | ELK Example Demo | ELK | InterviewDOT

Показать описание
WHAT ARE THE BENEFITS OF ELK ?
WHY ELK ?
ELK TUTORIAL FOR BEGINNERS
CENTRALIZED LOG MANAGEMENT
SPRING BOOT APPLICATION WITH ELASTIC SEARCH LOGSTASH KIBANA DEMO
SPRING BOOT APPLICATION WITH ELASTIC SEARCH LOGSTASH KIBANA STACK DEMO
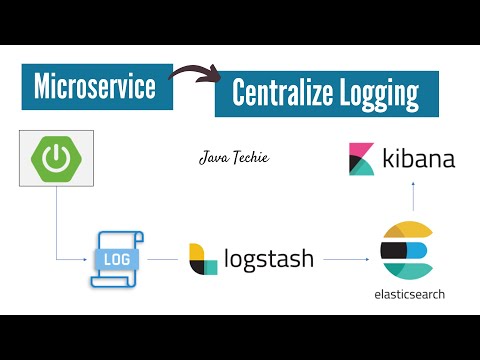
So, what is the ELK Stack? "ELK" is the acronym for three open source projects: Elasticsearch, Logstash, and Kibana. Elasticsearch is a search and analytics engine. Logstash is a server‑side data processing pipeline that ingests data from multiple sources simultaneously, transforms it, and then sends it to a "stash" like Elasticsearch. Kibana lets users visualize data with charts and graphs in Elasticsearch.
The Elastic Stack is the next evolution of the ELK Stack.
What is Elastic Stack ?
ELK Stack or Elastic Stack — ELK stack has been re-branded as Elastic Stack. The ELK stack is an amazing and powerful collection of three open source projects - Elasticsearch, Logstash, and Kibana. Despite each one of these three technologies being a separate project, they have been built to work exceptionally well together .
Elastic Stack is a complete end-to-end log analysis solution which helps in deep searching, analyzing and visualizing the log generated from different machines.
Yes, you read it right! Elastic stack reliably and securely takes data from any source, in any format, and search, analyze, and visualize it in real time. Elastic Stack provides a strong mechanism to perform centralized logging which plays an important role in identifying the web server and/or application related problems. It lets you search through all the logs at a single place and identify the issues spanning through multiple servers by correlating their logs within a specific time frame found in IT environments including use cases for web analytics, business intelligence, compliance and security.
What is Elastic Stack used for?
In today’s data dominated world, irrespective of the size of the organization, huge amount of data constantly flows into your systems on daily basis. As your data set grows larger, your analytics will slow up, resulting in sluggish insights. A considerable amount of this data is composed of the company’s web server logs. Logs are one of the most important and often-neglected sources of information. Each log file contains invaluable pieces of information which are mostly unstructured and makes no or little sense. Without a careful and detailed analysis of this log data, an organization can remain oblivious to both opportunities as well as threats surrounding it. Sigh!
So, the BIG question for your big data is: how can you maintain valuable business insights! Right? Don’t worry, here is where you need a log analysis tool.
Logging and Log Analysis
ELK Stack has become most popular open source platform for logging. Assume that you have to find an error. You need to log in to several machines and look at several log files. Now assume that you are maintaining larger applications distributed across several nodes. In that case, this process of searching in log files can become more tedious and messy. It is time to move beyond using Linux tools like grep.
What is the ELK Stack?
The ELK Stack is a collection of three open-source products — Elasticsearch, Logstash, and Kibana. They are all developed, managed ,and maintained by the company Elastic.
E stands for ElasticSearch: used for storing logs
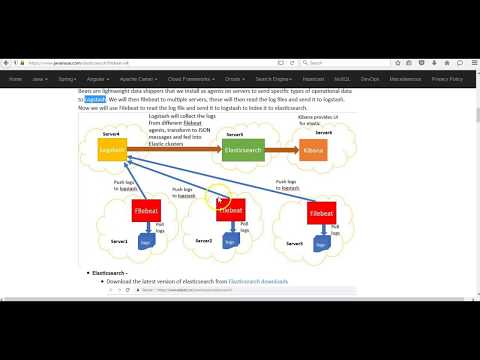
L stands for LogStash : used for both shipping as well as processing and storing logs
K stands for Kibana: is a visutalization tool (a web interface) which is hosted through Nginx or Apache
ELK Stack is designed to allow users to take to data from any source, in any format, and to search, analyze, and visualize that data in real time.
ELK provides centralized logging that be useful when attempting to identify problems with servers or applications. It allows you to search all your logs in a single place. It also helps to find issues that occur in multiple servers by connecting their logs during a specific time frame.
Logs: Server logs that need to be analyzed are identified
Logstash: Collect logs and events data. It even parses and transforms data
ElasticSearch: The transformed data from Logstash is Store, Search, and indexed.
Kibana: Kibana uses Elasticsearch DB to Explore, Visualize, and Share
WHY ELK ?
ELK TUTORIAL FOR BEGINNERS
CENTRALIZED LOG MANAGEMENT
SPRING BOOT APPLICATION WITH ELASTIC SEARCH LOGSTASH KIBANA DEMO
SPRING BOOT APPLICATION WITH ELASTIC SEARCH LOGSTASH KIBANA STACK DEMO
So, what is the ELK Stack? "ELK" is the acronym for three open source projects: Elasticsearch, Logstash, and Kibana. Elasticsearch is a search and analytics engine. Logstash is a server‑side data processing pipeline that ingests data from multiple sources simultaneously, transforms it, and then sends it to a "stash" like Elasticsearch. Kibana lets users visualize data with charts and graphs in Elasticsearch.
The Elastic Stack is the next evolution of the ELK Stack.
What is Elastic Stack ?
ELK Stack or Elastic Stack — ELK stack has been re-branded as Elastic Stack. The ELK stack is an amazing and powerful collection of three open source projects - Elasticsearch, Logstash, and Kibana. Despite each one of these three technologies being a separate project, they have been built to work exceptionally well together .
Elastic Stack is a complete end-to-end log analysis solution which helps in deep searching, analyzing and visualizing the log generated from different machines.
Yes, you read it right! Elastic stack reliably and securely takes data from any source, in any format, and search, analyze, and visualize it in real time. Elastic Stack provides a strong mechanism to perform centralized logging which plays an important role in identifying the web server and/or application related problems. It lets you search through all the logs at a single place and identify the issues spanning through multiple servers by correlating their logs within a specific time frame found in IT environments including use cases for web analytics, business intelligence, compliance and security.
What is Elastic Stack used for?
In today’s data dominated world, irrespective of the size of the organization, huge amount of data constantly flows into your systems on daily basis. As your data set grows larger, your analytics will slow up, resulting in sluggish insights. A considerable amount of this data is composed of the company’s web server logs. Logs are one of the most important and often-neglected sources of information. Each log file contains invaluable pieces of information which are mostly unstructured and makes no or little sense. Without a careful and detailed analysis of this log data, an organization can remain oblivious to both opportunities as well as threats surrounding it. Sigh!
So, the BIG question for your big data is: how can you maintain valuable business insights! Right? Don’t worry, here is where you need a log analysis tool.
Logging and Log Analysis
ELK Stack has become most popular open source platform for logging. Assume that you have to find an error. You need to log in to several machines and look at several log files. Now assume that you are maintaining larger applications distributed across several nodes. In that case, this process of searching in log files can become more tedious and messy. It is time to move beyond using Linux tools like grep.
What is the ELK Stack?
The ELK Stack is a collection of three open-source products — Elasticsearch, Logstash, and Kibana. They are all developed, managed ,and maintained by the company Elastic.
E stands for ElasticSearch: used for storing logs
L stands for LogStash : used for both shipping as well as processing and storing logs
K stands for Kibana: is a visutalization tool (a web interface) which is hosted through Nginx or Apache
ELK Stack is designed to allow users to take to data from any source, in any format, and to search, analyze, and visualize that data in real time.
ELK provides centralized logging that be useful when attempting to identify problems with servers or applications. It allows you to search all your logs in a single place. It also helps to find issues that occur in multiple servers by connecting their logs during a specific time frame.
Logs: Server logs that need to be analyzed are identified
Logstash: Collect logs and events data. It even parses and transforms data
ElasticSearch: The transformed data from Logstash is Store, Search, and indexed.
Kibana: Kibana uses Elasticsearch DB to Explore, Visualize, and Share
 0:09:53
TAMIL ELASTICSEARCH LOGSTASH KIBANA STACK | ELK Tutorial | ELK Example Demo | ELK | InterviewDOT
 0:06:30
What is ELK stack? Explain in Tamil (Part 1)
 0:06:12
ELK Stack - 1.1 Introduction in Tamil | Elastic Search | Logstash | Kibana
 0:20:44
Microservices Logging | ELK Stack | Elastic Search | Logstash | Kibana | JavaTechie
 0:09:53
What is Elasticsearch?
 0:25:09
Logstash Elasticsearch Kibana Tutorial | Logstash pipeline & input, output configurations.
 0:34:29
Realtime Bigdata analysis using Elasticsearch Logstash Kibana demonstration in Tamil
 0:03:13
What is the major use of Elasticsearch ? (Explained in Tamil)
 0:20:49
How to Install and Configure ELK stack v 7.9.3 (Elasticsearch, Logstash. Kibana) on Windows 7/8/10
 2:03:37
Elasticsearch Tutorial | Kibana, Logstash & Elasticsearch
 0:12:11
What Is Elasticsearch | Elasticsearch Explained | Elasticsearch | Intellipaat
 2:51:54
ELK Complete Fundamental Tutorials in Just 3 Hours
 0:14:26
Elk Stack Setup Made Simple: A Beginner's Guide
 0:20:23
How to Centralize SpringBoot logs to ELK Elasticsearch using Filebeat and Logstash
 2:03:37
Elasticsearch Tutorial for Beginners
 3:53:06
ELK Stack Tutorial For Beginners | Elastic Stack Tutorial | DevOps | Intellipaat
 0:14:35
How To Setup ELK | Elastic Agents & Sysmon for Cybersecurity
 1:12:05
Elasticsearch Tutorial | ELK Stack Tutorial | Intellipaat
 0:19:10
Install Elasticsearch Kibana and Logstash with Docker
 0:13:41
Installation of Elasticsearch with Kibana & Logstash on Ubuntu Server 22.04 LTS
 0:12:43
Filebeat + ELK (Elasticsearch,Logstash,Kibana)
 0:11:38
Elasticsearch Introduction and terminology
 0:28:52
Data pipeline using Kafka - Elasticsearch - Logstash - Kibana | ELK Stack | Kafka
 0:06:14
View Backend Logs using Kibana & Elasticsearch Tutorial
Комментарии