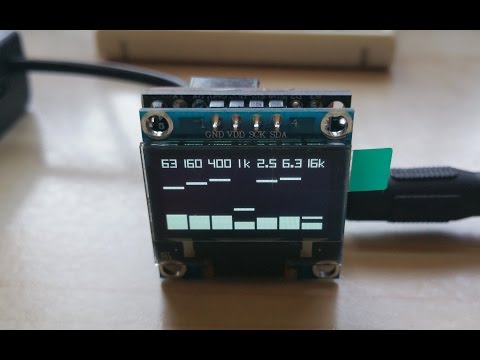
Arduino Spectrum Analyzer with OLED Display

preview_player
Показать описание
Here I build an Arduino spectrum analyzer with a 128x64 OLED display showing 64 frequency bins and testing the limits of a 16 MHz Arduino Uno using the analogRead function (better performance is possible by directly controlling the ADC).

Using a signal generator and sweeping a test waveform, the functionality is validated, including observed limitations due to aliasing when the input frequency is too high for the sample rate.

Рекомендации по теме
Комментарии
Автор

This is the best tutorial regarding FFT audio spectrum analysis for programmers.

pietrononame
Автор

I can finally understand the sketch! Thank you 😊

fernyias
Автор

This is one of your best videos. I have tears in my eyes right now. You have the perfect blend of intellectual honesty, and the drive to explain in plain, obvious terms.

GnuReligion
Автор

Arduino is a tool, libraries are tools, not necessary to have a deep understanding of all tools we use.. This was a very good explanation, staying on a level without heavy math and more important the mind twisting abstraction an EE studies for at least 2-3 semester (and further if you go dsp or telco specialization): going back and forth between time and frequency domain, Fourier, Laplace, Z, plus all the inverse transformation and even sicker stuff when the above is combined stochastic processes.. This latter comes into play in telco a lot. 👍

laszlovona
Автор

Your explanations are great.
Thank you.

bobbunni
Автор

wow, every time i get into this fft i learn a little more... very nice explanation... i would like to use this for looking 60 Hz dirty line power harmonics... thanks...:) 😊

qzorn
Автор

Great video cant wait to try this later.

WilliamDeboer
Автор

Just found the video. I do not fully understand what is going on in all of it. Here is what you helped me with. I was trying to make a band scope for ham radio. I could not figure out or understand what the ghosting was. I understand now what is happening, sort of. How to fix it though. Need lots and lots of samples, taken at a fast rate. Need a fast number cruncher. Now to find out how to get only relevant data to show up.

johncundiss
Автор

How can we determine output from the spectrum generated? Someone Please Tell Me!

HarshKumar
Автор

I just can't get the visuals youre getting on the OLED with using copy-paste code...i get a line here and there, and baseline seems to be "under" the screen

zkljaja
Автор

Hey, great project, I was wondering how can I print in the IDE's serial monitor the value that the OLED is showing, I mean the process signal after the FFT?, I tried printing "DAT" but it only shows low values and I want for it to show me the signal frequency

jaimem
Автор

I really like the reasoning and the research you have done to carry out this project, unfortunately you have run into the usual problem concerning the sampling frequency and the machine cycles for the calculations related to our good and beloved old Arduino.
Let me suggest one thing: don't give up and "try" with an ESP32, maybe you will also find many other interesting functions.

oscarilmio
Автор

Very cool projects! Congrats! Nyquist's theorem is wonderful thing. Since you are only using the 1st 64 elements in your arrays to draw lines ... perhaps those arrays need only be 64 elements in size? 😏👉

HazeAnderson
Автор

Sketch worked very well. But I had to add two parameters:
#define SCREEN_WIDTH 128
#define SCREEN_HEIGHT 64
Until I added these lines the display did not show the data properly. It seems to have defaulted to 64x32 mode.

patrickfitzgerald
Автор

Thanks for the demo and the detailed explanation. I learned the basics and I plan to assemble this curcuit. I heard that the Fast Hartley Transform is faster and less "resource" demanding. Any chance to try this approach and compare the results? This way it might capture a wider frequency range, too.
Keep up the good work.

Attilator
Автор

Nice project. But, your explanation of the "upper" 64 FFT samples is a little off. Those actually contain the FFT points at negative frequencies between -4480 and -70 Hz (based on 9 KHz sample rate and 128 samples).

Because you're sampling a purely real signal, the magnitude of its FFT is an even function of frequency. Thus, those "upper" 64 samples contain no addition information and there's no need to consider them.

gregvalvo
Автор

If I added "low" pass filter up to 5KHz or band pass filter up to 4 KHz...could I increase the resolution? If I had 9KHz sample rate, but only 0-4.5 KHz to fit in 128 bins, would that give me 35 Hz wide bins?

zkljaja
Автор

hi everyone in my case i don't have an OLED what can I change in the code to display it on serial plotter ?? need your help, please

medb
Автор

What voltage lipo battery do you think i can use with this

waynepryce
Автор

hello, im a newbie can u show me how to setup the analyzer and arduino

wheresblxckstar
join shbcf.ru