filmov
tv
AP Calculus AB TOPIC 6.1 Exploring Accumulations of Change

Показать описание
### Learning Objective: CHA-4.A
**Interpret the meaning of areas associated with the graph of a rate of change in context.**
This learning objective focuses on understanding how to interpret the areas under the curve of a function representing a rate of change, such as velocity, growth rate, or flow rate, and how these areas correspond to accumulated change in a particular context.
### Essential Knowledge:
1. **CHA-4.A.1**: The area of the region between the graph of a rate of change function and the x-axis gives the accumulation of change.
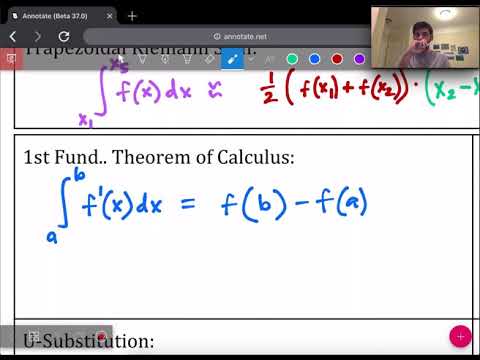
- **Interpretation**: This principle asserts that the definite integral of a rate of change function over a specific interval yields the total accumulated change over that interval. For instance, if the rate of change is velocity, the area under the velocity-time graph represents the total displacement.
2. **CHA-4.A.2**: In some cases, accumulation of change can be evaluated by using geometry.
- **Interpretation**: When the graph of a rate of change forms simple geometric shapes (like rectangles, triangles, or circles), the area can often be calculated using geometric formulas. This method allows for quick and accurate computations of accumulated changes without performing integration.
3. **CHA-4.A.3**: If a rate of change is positive (negative) over an interval, then the accumulated change is positive (negative).
- **Interpretation**: This essential knowledge highlights that the sign of the rate of change function determines the direction of the accumulation. A positive rate of change indicates an increase (e.g., gaining distance or volume), while a negative rate indicates a decrease (e.g., losing distance or volume).
4. **CHA-4.A.4**: The unit for the area of a region defined by rate of change is the unit for the rate of change multiplied by the unit for the independent variable.
- **Interpretation**: This principle emphasizes that when calculating the area under a curve representing a rate of change, the resulting units reflect the nature of the quantities involved. For example, if the rate of change is in liters per minute (L/min) and the independent variable is time in minutes (min), the area will have units of liters (L), indicating the total volume accumulated.
### Conclusion:
This learning objective and its associated essential knowledge provide a foundational understanding of how to interpret and calculate areas under curves representing rates of change. By mastering these concepts, students will be equipped to analyze real-world situations where accumulation of change is crucial, such as in physics, biology, and economics.
I have many informative videos for Pre-Algebra, Algebra 1, Algebra 2, Geometry, Pre-Calculus, and Calculus. Please check it out:
/ nickperich
Nick Perich
Norristown Area High School
Norristown Area School District
Norristown, Pa
#math #algebra #algebra2 #maths #math #shorts #funny #help #onlineclasses #onlinelearning #online #study
 0:12:36
 0:07:43
 0:12:23
 0:24:05
 0:08:24
 0:09:29
 0:14:00
 0:50:02
 1:38:45
 0:10:39
 0:04:32
 0:09:26
 0:00:51
 0:01:09
 0:23:58
 0:06:04
 1:02:30
 0:19:05
 0:13:41
 0:11:21
 0:33:46
 0:15:25
 0:18:57
 0:07:08