filmov
tv
How to Plot Double Y-Axis Graph in MATLAB software complete step-by-step process I In English I
Показать описание
Dear friends,
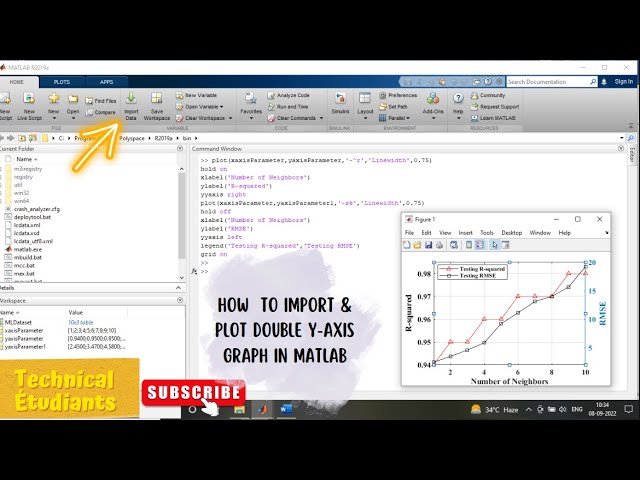
In this tutorial, you will learn, different methods of Importing data in MATLAB software using Excel Sheet & MATLAB Code along with plotting double Y-axis graph in MATLAB.
MATLAB Code ( Refer this Basic Code while Plotting Double Y-axis Graphs)
Define x and y parameter where 'x' is your x-axis parameter while 'y1' &'y2' is your y-axis parameter showing R-squared & RMSE values w.r.t. number of neighbors i.e., input parameter 'x'.
x= [1 2 3 4 5]
y1= [0.54 0.64 0.74 0.84 0.98]
y2= [2 7 11 15 19]
plot(x,y1,'-^r','Linewidth',2)
xlabel('Number of Neighbors')
ylabel('R-squared')
yyaxis right
plot(x,y2,'-sb','Linewidth',2)
xlabel('Number of Neighbors')
ylabel('RMSE')
yyaxis left
legend('Testing Data', 'Training Data')
grid on
other way is to just use the command to access the data imported in MATLAB.
Here,
change 'x' to the name showing in workspace having x-axis data. Similarly, change 'y' parameter name to the one shown in workspace to access that data directly from workspace while plotting a graph in MATLAB. Also use the condition hold on & off if you have multiple output values.
plot(x,y1,'-^r','Linewidth',2)
//plot(xaxisParameter, yaxisParameter,'-^r','Linewidth',2)
hold on
xlabel('Number of Neighbors')
ylabel('R-squared')
yyaxis right
plot(x,y2,'-sb','Linewidth',2)
//plot(xaxisParameter, yaxisParameter1,'-sb','Linewidth',2)
hold off
xlabel('Number of Neighbors')
ylabel('RMSE')
yyaxis left
legend('Testing Data', 'Training Data')
grid on
This video is about MATLAB Software in which we have studied the step by step procedure of importing the data to MATLAB from the excel sheet either in the form of complete table or in the form of importing the each columns data to the workspace. Also, you can use the command to plot the graph using the parameters imported in the workspace or you can also define them in the new script window of MATLAB software while writing the code. You will get a very good quality and magnified graphs in MATLAB software which is one of the best software for quality graphs in research publications. The software is highly recommended for drawing high resolutions diagrams for publications in journal papers. The plots/graphs obtained in MATLAB software are far better than Excel graphs or others.
The research related content considering block diagram, graphs, paper format, writing Journal papers, Tables, references format, submission in journals, reply to reviewers comments, software use for simulation and obtaining results, Preparing research proposal for PhD . All the related contents are covered in this channel.
So, stay tuned for such videos ......
For any queries related to Optisystem Software, MATLAB, Originlab, MS Excel, Implementation of Machine Learning using MATLAB in optical domain, research related project work, journal publication or manuscript submission in SCI, Scopus Indexed journals and IEEE conferences you can contact us on
Also, follow us on Instagram for finding the latest updates related to research and technical contents
Also, you can follow me on my Instagram handle
Insta Id- sharma_anchl
▬▬▬▬▬▬▬▬▬▬▬▬▬▬▬▬▬▬▬▬▬▬▬▬▬
Also Like, Share & Subscribe our Technical Étudiants Channel
▬▬▬▬▬▬▬▬▬▬▬▬▬▬▬▬▬▬▬▬▬▬▬▬▬
👋 About this channel: Hi, I am Aanchal Sharma and I am here to help you with all kind of research related queries whether it be related to software usage, writing synopsis or proposals, research paper writing and publication.
#DoubleY-axisGraphinMATLAB
#MATLABcode
#MATLAB tutorial
#MATLAB
#Data Import
#ImportDatainMATLAB
Shortcut Tricks to of importing data to MATLAB from Excel Sheet, How to make Quality Graphs in MATLAB, How to plot Double Y-Axis Graph in MATLAB using MATLAB Code, MATLAB Code for Double Y-Axis Graph, Procedure how to plot Two Y-axis Graphs in Single Graph in MATLAB, One X and Two Y axis Graph in MATLAB, How to define variables in MATLAB, how to write MATLAB Code to plot a line Graph, How to define a color code in MATLAB Code, How to import a data using a MATLAB code, How to copy the figure to the manuscript directly from the MATLAB without saving,
#DifferentMethodsofDataImport
#official_edulearning
#Technical Étudiants
 0:05:37
 0:07:11
 0:02:55
 0:01:56
 0:00:39
 0:04:54
 0:01:03
 0:02:04
 0:02:51
 0:06:27
 0:07:49
 0:01:42
 0:02:48
 0:04:16
 0:03:23
 0:00:28
 0:12:45
 0:02:07
 0:05:08
 0:05:54
 0:10:20
 0:03:57
 0:01:09
 0:06:03