filmov
tv
NASA perpetual ocean.mp4

Показать описание
Perpetual Ocean
NASA/Goddard Space Flight Center Scientific Visualization Studio
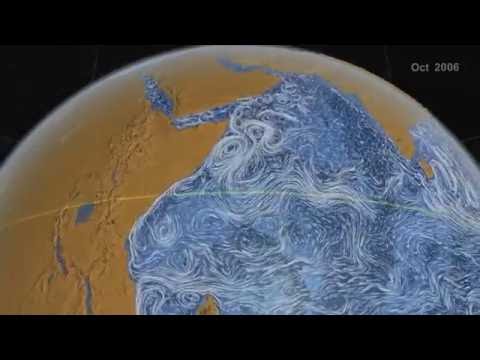
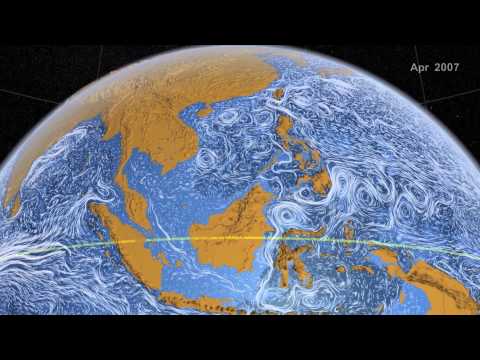
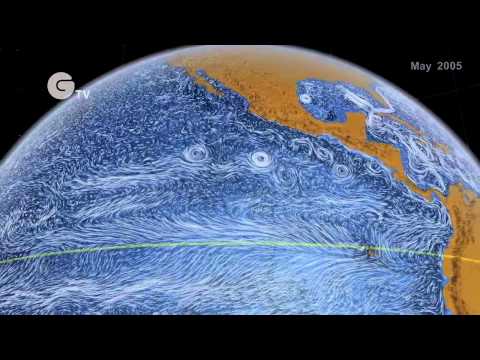
This visualization shows ocean surface currents around the world during the period from June 2005 through Decmeber 2007. The visualization does not include a narration or annotations; the goal was to use ocean flow data to create a simple, visceral experience.
This visualization was produced using NASA/JPL's computational model called Estimating the Circulation and Climate of the Ocean, Phase II or ECCO2.. ECCO2 is high resolution model of the global ocean and sea-ice. ECCO2 attempts to model the oceans and sea ice to increasingly accurate resolutions that begin to resolve ocean eddies and other narrow-current systems which transport heat and carbon in the oceans.The ECCO2 model simulates ocean flows at all depths, but only surface flows are used in this visualization. The dark patterns under the ocean represent the undersea bathymetry. Topographic land exaggeration is 20x and bathymetric exaggeration is 40x.
Please give credit for this item to:
NASA/Goddard Space Flight Center Scientific Visualization Studio
Using NASA Imagery and Linking to NASA Web Sites10.13.05
Still Images, Audio Files and Video
NASA still images, audio files and video generally are not copyrighted. You may use NASA imagery, video and audio material for educational or informational purposes, including photo collections, textbooks, public exhibits and Internet Web pages. This general permission extends to personal Web pages.
NASA/Goddard Space Flight Center Scientific Visualization Studio
This visualization shows ocean surface currents around the world during the period from June 2005 through Decmeber 2007. The visualization does not include a narration or annotations; the goal was to use ocean flow data to create a simple, visceral experience.
This visualization was produced using NASA/JPL's computational model called Estimating the Circulation and Climate of the Ocean, Phase II or ECCO2.. ECCO2 is high resolution model of the global ocean and sea-ice. ECCO2 attempts to model the oceans and sea ice to increasingly accurate resolutions that begin to resolve ocean eddies and other narrow-current systems which transport heat and carbon in the oceans.The ECCO2 model simulates ocean flows at all depths, but only surface flows are used in this visualization. The dark patterns under the ocean represent the undersea bathymetry. Topographic land exaggeration is 20x and bathymetric exaggeration is 40x.
Please give credit for this item to:
NASA/Goddard Space Flight Center Scientific Visualization Studio
Using NASA Imagery and Linking to NASA Web Sites10.13.05
Still Images, Audio Files and Video
NASA still images, audio files and video generally are not copyrighted. You may use NASA imagery, video and audio material for educational or informational purposes, including photo collections, textbooks, public exhibits and Internet Web pages. This general permission extends to personal Web pages.
 0:03:03
NASA perpetual ocean.mp4
 0:03:03
Perpetual Ocean - Video from NASA / JPL
 0:10:01
Perpetual Ocean Full Version
 0:03:03
Perpetual Ocean - Mother Nature in Motion - NASA
 0:03:03
Perpetual Ocean
 0:03:42
Perpetual Ocean
 0:01:07
Global Sea Surface Currents and Temperature [1080p]
![[adult swim] Perpetual](https://i.ytimg.com/vi/tN1nTlU99ao/hqdefault.jpg) 0:00:16
0:00:16
[adult swim] Perpetual Ocean Animation
 0:03:03
Perpetual Ocean - A realistic view of the chaos of circulating water in the Eath's Oceans
 0:01:07
NASA GSFC Movie of Ocean Currents overlayed with Sea Surface Temps
 0:00:51
Gulf Stream Sea Surface Currents and Temperatures.mp4
 0:02:12
Ocean Current Flows around the Mediterranean Sea for UNESCO
 0:05:19
Fanfare dOrdue & Perpetual OCEAN
 0:00:39
NASA Sea Currents
 1:12:01
Perpetual Ocean
 0:03:03
NASA | Flussi oceanici perpetui (HD 1080p)
 0:00:25
Sea Surface Temperature (2002-2006) [720p]
 0:02:23
7 Our perpetual ocean French exhibition
 0:02:12
Ocean Current Flows around the Mediterranean Sea and Atlantic
 0:04:45
Modeling Dynamic Surface Ocean Currents (with annotations)
 0:00:54
Ocean surface currents
 0:03:16
CO2 flux and wind stress
 0:00:20
La Niña: Sea Surface Temperature and Sea Surface Height Anomalies
 0:00:45
RSS SMAP Sea Surface Salinity 70km 8-Day Global Animation
Комментарии